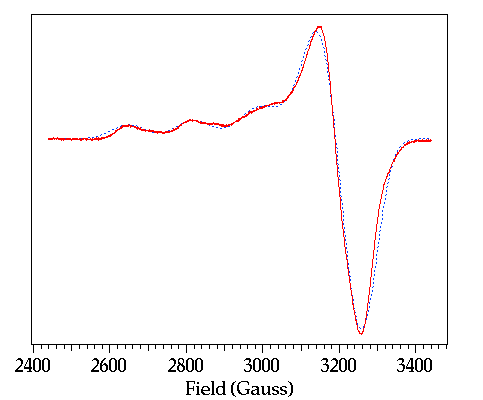
Figure 8. Experimental and simulated EPR spectra of
oxidized
DProPHM-382s. The
spectrometer settings were as follows: microwave frequency, 9.105 GHz;
modulation
amplitude, 20 G; microwave power, 20 mW; spectrometer gain, 8 * 10^3 ;
T = 120
K. The experimental spectrum is the average of nine scans. The
following
parameters were used in the simulation: g(z) = 2.245, g(x,y) = 2.036,
A(z) = 167 G, A(x,y)
= 12.7 G, line widths w(z) = 51 G, w(x,y) = 41
G. The
total copper concentration was 112 mM. The dashed line shows
simulation.
Back
to PHM paper