3. Electron Paramagnetic Resonance Detection of Chromium(V) and Chromium(III) Species Formed During the Reduction of Chromium(VI) By Thiols
In this study four different thiols,
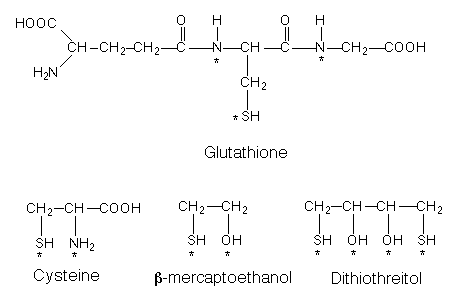
b-mercaptoethanol, dithiothreitol, glutathione, and cysteine (Figure 3-1) were incubated in the presence of chromium(VI) to determine the relative amounts of chromium(V) formed with each reducing agent. Frozen solution (77K) EPR spectroscopy was used to follow the formation and decay of chromium(V) species during the reactions. These EPR studies of the reaction of chromium(VI) with thiols were repeated in the presence of DNA in order to determine whether DNA affected the reactions. Reactions of chromium(VI) with b-mercaptoethanol resulted in strikingly different levels of chromium(V) formation in the presence of DNA.3.1. Results and Discussion
3.1.1. Reaction of Chromium(VI) with
The reaction of potassium dichromate, K
2Cr2O7, (0.48 mM chromium(VI)) with b-mercaptoethanol at pH 7.0 and 37 °C resulted in the formation of large amounts (up to 110 µM; 23% of total chromium) of relatively long-lived chromium(V) species, with g^ = 1.985, and g// = 2.003 (gav, calc. = 1.991; DH = 17.2 G) (Figure 3-2). The amount of chromium(V) formed depended on the amount of thiol present, with a 20:1 ratio of thiol to chromium effecting the highest concentration of chromium(V) (110 µM). For the 20:1 ratio (9.6 mM b-mercaptoethanol : 0.48 mM Cr(VI)), the chromium(V) species observed reached a maximum concentration about 5 minutes into the reaction and slowly decayed with time. Significant chromium(V) was detected 30 minutes after the start of the reaction (~40 µM). Figure 3-2 shows the chromium(V) signals observed for 20, 10, 5, and 3:1 ratios of thiol:Cr, respectively. As the ratio of b-mercaptoethanol:chromium(VI) increased, the intensity of the chromium(V) signal increased. A time course showing absolute chromium(V) concentration (as compared to a K3CrO8 standard of known concentration) as a function of time for all ratios is shown in Figure 3-3. These data show that at b-mercaptoethanol:chromium(VI) ratios of 10, 5 and 3:1 the level of chromium(V) increased for the first 5-10 minutes, and then remained fairly constant over 30 minutes. At a 20:1 b-mercaptoethanol:chromium(VI) ratio, the level of chromium(V) reached a maximum at 5 minutes after the start of the reaction, and slowly decreased over 30 minutes.The ultimate fate of the chromium in these reactions is a chromium(III) species. Figure 3-4 shows the typical broad 77K chromium(III) EPR signals observed at later time points in these reactions. A mixture of hexaaquochromium(III) (480 µM) and
b-mercaptoethanol (1:20 ratio) resulted in an EPR spectrum nearly identical to the final EPR spectra obtained of the reaction of chromium(VI) (480 µM) with b-mercaptoethanol (1:20 ratio) (Figure 3-4). That ligand substitution on the chromium(III) center has occurred was evidenced by the loss of the hexaaquochromium(III) EPR signal (g = 1.980, DH = 138 G) upon incubation with b-mercaptoethanol (Figure 3-4). Stock hexaaquochromium(III) showed no change over time, while introduction of b-mercaptoethanol resulted in a 3-fold decrease in signal over 5 minutes, and a complete loss of the hexaaquochromium(III) signal within 24 hours (Figure 3-4). Opening the spectral window in this reaction by using a sweep width of 5000 Gauss revealed no new features in the spectra. There was no change in the spectra with further incubation after 24 hours, indicating that the final, thermodynamic product in both cases (ligand substitution on chromium(III) and reduction of chromium(VI)) is the same.Figure 3-
3.1.1.1. Discussion
The reaction of chromium(VI) with
b-mercaptoethanol resulted in the formation of relatively long-lived chromium(V) species, as evidenced by EPR spectroscopy. The most important structural feature these spectra reveal is that the chromium(V) species formed have an axial geometry, as evidenced by the g^ = 1.985, and g// = 2.003 spectral features (Figure 3-2). For all ratios of thiol: chromium, it is apparent that more than one chromium(V) species is formed, as evidenced by the shoulder present on the g = 1.983 feature. This shoulder almost coalesces into a single feature at high thiol:chromium ratios (Figure 3-2); however as the ratio of thiol:chromium is decreased, the presence of a second component to the spectrum becomes more pronounced (Figure 3-2). One can infer from these data that one chromium(V) species predominates at higher thiol:chromium ratios, while at lower ratios the difference in concentration of the two species is much smaller.Consistent with the data presented is a mechanism for the formation of chromium(V) species which involves initially a single
b-mercaptoethanol moiety bound to chromium in a bidentate fashion. As the reaction proceeds, another molecule of b-mercaptoethanol is bound to chromium, and the main (most intense) signal (at higher g-value) is seen to increase in intensity. Since the reaction is accelerated at higher thiol:chromium ratios (Figure 3-3), the less intense signal due to the mono-chelated chromium(V) is seen only as a shoulder at the higher ratios. The rate of decay of the overall chromium(V) signal is also accelerated at higher ratios. As the ratio is decreased, one is able to distinguish a definite signal arising from the mono-chelated chromium(V) species, at lower g-value (Figure 3-2). This is also consistent with a change in coordinating atoms from O (as H2O) to S and O ligation (as b-mercaptoethanol). The signal due to a mono-chelated chromium(V) is at a lower g-value (g = 1.983) than the bis-chelated chromium(V) (g = 1.985). This is because as more sulfur is introduced into the coordination sphere, the covalency of the ligand-chromium bond is increased. This in turn leads to a decrease in the applied magnetic field required for resonance to occur (which translates to higher g-values).3.1.1.2. Reaction of Chromium(VI) with
b-mercaptoethanol in the presence of DNAThe reaction of potassium dichromate, K
2Cr2O7, (0.48 mM chromium(VI)) with b-mercaptoethanol (9.6 mM) in the presence of double-stranded calf-thymus DNA (CT DNA) (0.048 mM) at pH 7.0 and 37 °C resulted in the formation of very large amounts (~290 µM; 60.4% of total chromium) of relatively long-lived chromium(V) species, with g^ = 1.985, and g// = 2.003 (gav, calc. = 1.991, DH = 17.0 G) (Figure 3-5). The amount of chromium(V) formed was 2.6-fold higher than the same reaction in the absence of DNA (Figure 3-2). For the 20:1 ratio (9.6 mM b-mercaptoethanol : 0.48 mM Cr(VI)), the chromium(V) species observed reached a maximum concentration about 20 minutes into the reaction and slowly decayed with time (Figure 3-6). Significant chromium(V) was detected 30 minutes after the start of the reaction (~240 µM). For the 10, 5, and 3:1 ratios of thiol:Cr, a higher amount of chromium(V) was again detected in this reaction vs. without DNA, and the signal due to chromium(V) was still increasing after 30 minutes incubation (Figures 3-5, 6).Room temperature EPR (RT EPR) of the reaction of chromium(VI) (0.48 mM) with
b-mercaptoethanol (9.6 mM) in the presence of CT DNA (0.048 mM) at pH 7.0 clearly shows the presence of two moderately resolved chromium(V) species, (gav = 1.988, DH = 2.03 G, a = 17.6 G; gav = 1.986; Figure 3-7). Comparison with the spectra of the same reaction in the absence of DNA again shows that two chromium(V) species are formed (gav = 1.988, DH = 1.96 G, a = 17.4 G; gav = 1.986; Figure 3-7). In the absence of DNA, however, the ratio of the gav = 1.988:gav = 1.986 signals is lower (~2.1 at 16 minutes) than for the reaction in the presence of DNA (~3.0 at 18 minutes). This indicates that the relative amounts of the various chromium(V) species formed varies depending on the presence of DNA. A plot of chromium(V) signal intensity vs. time for the reaction in the presence of DNA is shown in Figure 3-8. The data shown suggest that the signals arising from the two separate chromium(V) species in the presence of DNA increase at different initial rates until an equilibrium is reached at about 30 minutes, at which time the chromium(V) signals remain relatively constant for at least 60 minutes.Since a large amount of relatively stable chromium(V) is formed in the reaction of
b-mercaptoethanol with chromium(VI) in the presence of DNA, the parameters used in the RT EPR detection of the signals were modified so as to resolve any spectral features not apparent under normal operating conditions. For example, at a 10-fold lower modulation amplitude, 0.1 G (with a corresponding 10-fold increase in microwave power, 20 mW), the spectrum observed (gav = 1.988, DH = 1.96 G, a = 17.6 G; gav = 1.986) revealed that no further spectral resolution can be achieved under the reaction conditions employed.In an effort to elucidate the role of DNA in these reactions, various polydeoxynucleotides as well as single-stranded CT DNA were substituted for double-stranded CT DNA and the effects compared. Figure 3-9 shows the spectra obtained in the reaction of chromium(VI) (0.48 mM) with
b-mercaptoethanol (9.6 mM) in the presence of single-stranded CT DNA (0.048 mM) or in the presence of CT DNA (0.48 mM) at pH 7.0 and 37 °C. The spectra obtained were identical to those observed in the presence of double-stranded CT DNA (0.048 mM, Figure 3-5). Figure 3-9 also shows the spectrum obtained when the concentration of double-stranded CT DNA was decreased 40-fold to 0.0012 mM. The spectrum observed is identical to those observed in the absence of DNA (Figure 3-2). A 16-fold decrease in double-stranded CT DNA concentration to 0.003 mM shows an effect midway between the two extremes.Incubation of chromium(VI) (0.48 mM) with
b-mercaptoethanol (9.6 mM) in the presence of 5'-dGMP, 5'-dGTP, poly(dA) or poly(dC) (0.048 mM) had no effect on the reaction, and the spectra obtained are identical to those obtained in the absence of DNA (Figure 3-2). However, incubation in the presence of poly(dG) (0.048 mM) results in spectra similar to double-stranded CT DNA, and even higher maximum levels of chromium(V) (~320 µM, 66.7% of total chromium). Figure 3-10 shows the time courses obtained for the various concentrations of DNA and nucleotides, as compared to reactions not involving DNA. These data show that even very low DNA concentrations (0.003 mM; 160:1 Cr:DNA ratio), effect an increase in the levels of chromium(V) formed, and also modify the time-course of the reaction. These data also show that the structure and composition of the DNA is also important to the modulation of chromium(V) species formed in these reactions.3.1.1.2.1 Discussion
The EPR spectra of the reaction of chromium(VI) (0.48 mM) with
b-mercaptoethanol (1.44-9.6 mM) observed in the presence of DNA are similar to those observed in the absence of DNA (g^ = 1.985, and g// = 2.003). However, the signals in the presence of DNA tend to be more broad, and at the lower ratios the g^ = 1.985 feature becomes much more resolved, emerging from a shoulder observed at this g-value at higher ratios (Figure 3-5). Another striking difference is seen in the time courses of these reactions (Figure 3-6), where for the 20:1 b-mercaptoethanol:chromium ratio it is observed that the maximum chromium(V) concentration (290 µM) occurs much later after the start of the reaction (> 20 minutes) than in the absence of DNA (110 µM) (~ 5 minutes, Figure 3-3). The presence of DNA also serves to stabilize the chromium(V) formed, since at 30 minutes the level of chromium(V) observed is still 80.9% of the maximum level (237.0 µM). However, in the absence of DNA, not only are the maximal levels lower, but at 30 minutes the chromium(V) concentration is only 27.8% of the maximal level (27.0 µM). For the lower (10,5,3:1) b-mercaptoethanol:chromium ratios, the time courses for the reactions in the presence of DNA indicate that the chromium concentration is still increasing after 30 minutes. The reactions done in the absence of DNA clearly reach maximal levels of chromium(V) within 5-10 minutes after the start of the reactions, and the levels of chromium(V) were observed to decrease over the 30 minute course of the reaction.The room temperature EPR spectra of the reaction of chromium(VI) with b-mercaptoethanol (20:1 thiol:chromium ratio) clearly show the presence of two chromium(V) species, with very similar gav-values (1.988, 1.986; Figure 3-7). When the formation of these separate chromium(V) signals is followed over time, it is apparent that the initial rates of formation for the two signals are different. The g = 1.988 signal appears to increase at a slower overall rate as compared to the g = 1.986 signal; it should be noted, however, that the g = 1.986 signal is a minor component of the EPR spectrum, and its close proximity to the very intense g = 1.988 signal makes accurate quantitation difficult.
The 77 K EPR spectra observed for different ratios of
b-mercaptoethanol:Cr in the presence of DNA (Figure 3-5) clearly indicate that the major species in these reactions is also dependent upon the thiol concentration. At low thiol:Cr ratios, a species with a lower g-value (~1.985) predominates, while at higher ratios a species with g Å 1.990 predominates. In any case, the difference in the rates of formation and relative spectral intensities for the two species is consistent with initially a single b-mercaptoethanol molecule bound to the chromium center (I), and a second b-mercaptoethanol moiety subsequently bound (II):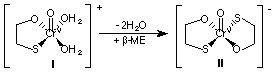 . As oxygen (O) from water is replaced by sulfur (S) from b-mercaptoethanol at the chromium(V) center, the observed g-value should increase due to a higher covalency in the Cr-S vs. the Cr-O bond, and this is the trend observed in the EPR spectra. The final bis-(b-mercaptoethanol)chromium(V) species (II) is assigned to the major signal at higher g-value (g = 1.990) observed in the EPR spectrum at higher ratios.
The presence of DNA in the reactions of chromium(VI) with
b-mercaptoethanol serves to modify the time-course of the reactions, and it changes the lineshape of the EPR spectra observed. It does not, however, affect the proposed mechanism, whereby a mono-(b-mercaptoethanol)-Cr(V) species is formed prior to the final bis-(b-mercaptoethanol)-Cr(V) species. Figure 3-9 shows that double-stranded and single-stranded DNA has the same effect on the EPR spectra of these reactions at either 1:10 or 1:1 DNA:Cr concentrations. A 1:400 DNA:Cr concentration has the same effect as no DNA, and a 1:160 DNA:Cr ratio has an intermediate effect on chromium(V) formation (and thus EPR spectra observed). The structure of the DNA employed is also critical for an effect on chromium(V) formation to be observed. Nucleotides alone or poly(dA) or poly(dC) have no effect on the reactions, however, poly(dG) effects a significant increase chromium(V) formation (Figure 3-10). Since even low DNA:Cr ratios (1:80) have a significant effect on the stability and amount of chromium(V) formed in these reactions, it is possible that DNA serves to trap other reactive species prior to their contact with chromium(V), thus hindering further reduction of chromium(V).3.1.1.3. Effect of DETAPAC, DES, and DMPO on the Reaction of Chromium(VI) with
b-mercaptoethanolTo further elucidate the role of DNA in the reaction of chromium(VI) (0.48 mM) with
b-mercaptoethanol (9.6 mM) at pH 7.0 and 37 °C, two metal-chelating agents, diethylenetriaminepentaacetic acid (DETAPAC) and deferoxamine mesylate (DES), were substituted for DNA in these reactions in an effort to determine the role that DNA may have played in analogous reactions.. To examine the possible role of other reactive intermediates in these systems, reactions were also performed in the presence of a spin-trapping agent, 5,5-dimethyl-1-pyrroline-N-oxide (DMPO) to allow detection of any reactive radical intermediates formed during the reaction of b-mercaptoethanol and chromium(VI)..Figure 3-11 shows the time course of chromium(V) formation for the reaction of chromium(VI) (0.48 mM) with
b-mercaptoethanol (9.6 mM) in the presence of DETAPAC (0.48 mM) or DNA (0.048 mM) at pH 7.0 and 37 °C. The maximal levels of chromium(V) formed (>320 µM; >67% of total chromium), as well as the time-course of the chromium(V) species are very similar for the reactions in the presence of DNA or DETAPAC. It is clear from the data shown that DETAPAC has the same effect on chromium(V) formation in these reactions as DNA. Also, the g-values and lineshapes of the spectra in the presence of DNA and DETAPAC compared favorably; there was no evidence for DETAPAC-chromium(V) complex formation.Figure 3-12 shows the RT EPR spectra obtained from the reaction of chromium(VI) (0.48 mM) with
b-mercaptoethanol (9.6 mM) in the presence of DETAPAC (0.48 mM) and DMPO (100 mM) at pH 7.0 and 37 °C. Two chromium(V) signals are observed (g = 1.988, DH = 2.15 G; g = 1.986). Control spectra obtained in the absence of chelator or spin-trap (Figure 3-12) also showed the presence of two chromium(V) signals (g = 1.988, DH = 1.95 G, a53Cr = 17.2 G; g = 1.986). The inset to Figure 3-12 shows the spectrum characteristic of a DMPO-SR radical (arising from the thiyl radical being trapped by DMPO; aH = 16.8, aN = 15.3, g = 2.008) which was obtained during these reactions. The most intense chromium(V) signal was obtained in the presence of the spin-trap, DMPO. Almost quantitative conversion of chromium(VI) to chromium(V) was observed in reactions performed in the presence of 100 mM DMPO and 0.48 mM DETAPAC (~470 µM; 98% of total chromium). The chromium(V) species formed were also quite stable, persisting at these high levels for at least 60 minutes.The chelator DES had less effect on chromium(V) concentration than does DETAPAC in these reactions (Figure 3-13-A), and again there were two chromium(V) species observed (g = 1.988,
DH = 2.15 G, a53Cr = 17.2 G; g = 1.986). The presence of DMPO and DES in the reaction of chromium(VI) (0.48 mM) with b-mercaptoethanol (9.6 mM) effected a higher concentration of chromium(V) than just DES alone, but the highest chromium(V) concentration was effected by a combination of DETAPAC and DMPO. Figure 3-13-B shows the spin-trap region of the EPR spectra of these reactions. Again, the thiyl radical was clearly produced in these reactions (aH = 16.8, aN = 15.3, g = 2.008), and was produced at the highest levels for the reaction containing DETAPAC.The influence of molecular oxygen on these reactions was studied by performing the reaction of chromium(VI) (0.48 mM) with
b-mercaptoethanol (9.6 mM) at pH 7.0 and 37 °C in the presence of DETAPAC under anaerobic conditions. Figure 3-14-A shows the RT EPR spectra obtained during these reactions in the presence or absence of DETAPAC and the presence or absence of DMPO in an anaerobic environment. Two chromium(V) signals were observed (g = 1.988, DH = 1.95 G; g = 1.986). Again, the highest chromium(V) concentration was observed in the reaction mixture containing both DETAPAC and DMPO. The presence of DMPO alone produced only slightly higher chromium(V) levels than control reactions (which contained only b-mercaptoethanol and chromium(VI)), whereas the presence of DETAPAC produced an intermediate level of chromium(V) (Figure 3-14-A). Figure 3-14-B shows an enlarged view of the spin-trap region of Figure 3-14-A. The presence of DETAPAC clearly increased the amount of thiyl radical ( aH = 16.8, aN = 15.3, g = 2.008) formed in these reactions, or at least allows for more of the thiyl radical to be accessible by DMPO. Figure 3-15 gives a comparison of the radical species trapped in these reaction in the presence or absence of molecular oxygen. Figure 3-16 gives a comparison of the chromium(V) species formed in these reactions in the presence or absence of molecular oxygen. In the absence of oxygen, the reactions performed in the presence of DETAPAC clearly produce more thiyl radical and chromium(V) than identical reactions performed in the presence of oxygen.To further elucidate the role of oxygen in these systems, a computer simulation study was performed to obtain the levels of hydroxyl (•OH) radical formed during reaction of chromium(VI) (0.48 mM) with
b-mercaptoethanol (9.6 mM). Hydroxyl radical adducts of DMPO are observed in the same region of the RT EPR spectrum as thiyl radical adducts, and thus the spectra observed when both radical species are present is a combination of the individual radical spectra. The determination of relative amounts of each radical species relies on simulation of the individual spectra and subsequent mixing of spectra at various levels until a composite spectrum is obtained that matches the experimental spectrum. Figure 3-15 shows the results of such a study using the computer program SpinSim (see appendix). The top (solid) trace is the experimental spectrum obtained in the presence of DETAPAC and DMPO (aerobic). It should be noted that the two right-most features of the spectrum are not well resolved due to the presence of the a53Cr hyperfine signals at those positions, which serve to distort the lineshape of the DMPO radical adduct signals. The dotted trace is a simulated spectrum of a DMPO-thiyl radical adduct with hyperfine splitting constants of aH = 15.1, and aN = 16.13. The small-dashed trace is a similar simulation with a slightly larger hydrogen hyperfine value of 15.35. The bottom two traces in Figure 3-15 show the addition of either 10 or 50% DMPO-OH signal to the DMPO-thiyl signal. These data showed that the experimental spectrum was best simulated by a composite spectrum containing 90% thiyl radical and < 10% hydroxyl radical. Thus, hydroxyl radical was at best a minor component of this system.The possible role of other metal ions in the reaction of chromium(VI) (0.48 mM) with
b-mercaptoethanol (9.6 mM) was explored by adding ferrous ammonium sulfate to the reactions in the presence or absence of DETAPAC. Iron is often found as a contaminant in many of the salts used as buffers in these reactions. Even though the buffers in this study were treated with cation exchange resin to remove such metal impurities, it was thought that trace iron impurities may have been having an effect on these reactions. Thus, ferrous ammonium sulfate was added to the reaction of b-mercaptoethanol and chromium(VI), and the effect of added iron was monitored by EPR spectroscopy. Figure 3-17 shows the RT EPR spectra obtained in these reactions. Two chromium(V) signals are observed (Figure 3-17-A: g = 1.988, DH = 2.15 G; g = 1.986). The combination of DETAPAC (0.48 mM) and iron (0.48 mM) produced levels of chromium(V) at basically control levels (which were obtained in the absence of DETAPAC and iron). Interestingly, the highest levels of chromium(V) were produced in the presence of DETAPAC (0.48 mM) and iron (0.24 mM). Intermediate chromium(V) levels were observed with DETAPAC alone, while iron alone produced levels of chromium(V) higher than DETAPAC alone. Figure 3-17-B shows the spin-trap region of these reactions. A different trend was observed for the thiyl radical (aH = 16.8, aN = 15.3, g = 2.008) than for the chromium(V) species in these reactions. The highest thiyl radical concentration was observed with DETAPAC alone. The combination of DETAPAC (0.48 mM) and iron (0.48 mM) also produced relatively high levels of thiyl radical, and iron alone produced thiyl radical concentrations at control levels. The combination of DETAPAC (0.48 mM) and iron (0.24 mM) produced an intermediate amount of thiyl radical. Figure 3-18 compares the different chromium(V) and DMPO-SR levels obtained in these reactions. While the g-values and linewidths of the chromium(V) and DMPO-SR radical adduct signals were identical regardless of the presence or absence of added iron, the intensities of the signals followed different time-courses depending on whether or not iron was added. When no iron was added to the reaction in the presence of DETAPAC (0.48 mM), the DMPO-SR radical reaches maximal levels, while the chromium(V) signal is nearly the same whether or not DETAPAC is present. Addition of iron (0.24 mM) to the reaction dramatically increases the chromium(V) concentration (2X), while at the same time lowering the DMPO-SR concentration. When the iron concentration is increased to 0.48 mM, the chromium(V) levels decrease to those found in the absence of iron, while the DMPO-SR levels increase relative to 0.24 mM iron.3.1.1.3.1 Discussion
DNA has been shown in the above studies to effect higher chromium(V) concentrations during the reaction of
b-mercaptoethanol with chromium(VI) than in those reactions performed in the absence of DNA. It is thought that DNA in these reactions may be acting as a reactive species' trap, or sink, thus removing such species from the reaction sphere and preventing their interaction with any chromium(V) species formed. As a result, the chromium(V) concentration is allowed to reach higher levels, and any chromium(V) formed has a longer half-life due to the removal of some reactive species that may react with chromium(V). If this is the case, then substitution of the DNA with a species that could serve in an analogous capacity. i.e., DETAPAC or DES, should result in similar findings. This has proven to be the case with the studies discussed above, and Table 3-1 summarizes the EPR data obtained from those studies.Table 3-1. EPR spectral parameters for the chromium(V) and radical species formed in the reaction of
|
DNA a |
Chelator |
DMPOa (100 mM) |
g isob |
a 53Cr |
D Hb,c |
g //d |
g ^d |
D Hc,d |
g av (calc)c,e |
a H |
a N |
|
- |
- |
- |
1.988 |
n.d. f |
1.95 |
2.003 |
1.986 |
18.2 |
1.992 |
|
|
|
- |
- |
+ |
1.988 |
17.4 |
2.15 |
n.d. |
n.d. |
n.d. |
n.d. |
16.82 |
15.25 |
|
+ |
- |
- |
1.988 |
17.1 |
2.05 |
2.003 |
1.985 |
17.2 |
1.991 |
|
|
|
- |
DETAPAC |
- |
1.988 |
17.2 |
1.96 |
2.003 |
1.985 |
17.0 |
1.991 |
|
|
|
- |
DETAPAC |
+ |
1.988 |
n.d. |
2.15 |
n.d. |
n.d. |
n.d. |
n.d. |
16.81 |
15.25 |
|
+ |
DETAPAC |
- |
n.d. |
n.d. |
n.d. |
2.003 |
1.985 |
17.2 |
1.991 |
|
|
|
- |
DES |
- |
1.988 |
17.2 |
2.15 |
n.d. |
n.d. |
n.d. |
n.d. |
|
|
|
- |
DES |
+ |
1.988 |
17.2 |
2.15 |
n.d. |
n.d. |
n.d. |
n.d. |
16.81 |
15.25 |
a
+ indicates this species present in the reaction; b297 K, this is the major signal; cpeak-trough linewidth, G; d77 K; egav(calc) = (2(g^ ) + g//)/3; fn.d. = not determined.It is apparent that both DETAPAC and DES have the same effect as DNA on the chromium(V) signals observed, both in terms of spectral lineshape, g-values, and linewidths. The exact role DNA, DETAPAC, or DES plays in these reactions is not certain, but the evidence suggests that they act as radical scavengers, more specifically to trap
b-mercaptoethanol-derived thiyl radicals. This is supported by reactions done in the absence of either DNA or DETAPAC but in the presence of DMPO. The chromium(V) concentration in such reactions reaches the highest levels (>320 µM, >67% of total chromium), which are 2.5 times higher than reactions done in the absence of DMPO. Since DMPO is effectively acting as a radical scavenger, removing any reactive species from the reaction sphere, one can extend this explanation to reactions involving DETAPAC or DNA, and it is probable that they are acting in an analogous manner to DMPO. In all reactions performed in the presence of DMPO, the thiyl radical is trapped (as evidenced by the aN and aH hyperfine splitting constants). Thus, thiyl radical must play an important role in the mechanism by which chromium(V) is formed and subsequently decays in these reactions. When thiyl radical was removed from contact with chromium(V) (either by DNA, DETAPAC, or DMPO), the chromium(V) concentration dramatically increased vs. reactions in which thiyl radical was free to react with chromium(V).A possible series of reactions has been proposed which may comprise a mechanism consistent with these data, and they are outlined in Equations
[3-1] to [3-10]:Cr(VI) + RS-
Æ Cr(VI)(RS) [3-1]Cr(VI)(RS) + RS-
Æ Cr(V)(RS) + RS• [3-2]Cr(VI)(RS)
Æ Cr(V) + RS• [3-3]Cr(VI)(RS) + RS-
Æ Cr(VI)(RS)2 [3-4]Cr(VI)(RS)2 + RS•
Æ Cr(V)(RS) + RSSR [3-5]Cr(VI)(RS)2 + RS-
Æ Cr(V)(RS)2 + RS• [3-6]Cr(V)(RS) + RS-
Æ Cr(V)(RS)2 [3-7]Cr(V)(RS)2 + RS•
Æ Cr(IV)(RS) + RSSR [3-8]Cr(V)(RS)2 + 2RS-
Æ Cr(III)(RS)2 + RSSR [3-9]Cr(V)(RS) + RS
• Æ Cr(V) + RSSR [3-10]In this mechanism Cr(VI) refers to the initial chromium(VI), chromate, and RS- refers to deprotonated
b-mercaptoethanol. RS• refers to the b-mercaptoethanol thiyl radical. Many possibilities exist for reactions between thiols, thiyl radicals, and chromium species. Equation [3-1] refers to the formation of a chromium(VI) thioester (21), which can then either react with another molecule of thiol to form a b-mercaptoethanol-Cr(V) complex and thiyl radical ([3-2]), or can be reduced intramolecularly to form Cr(V) and thiyl radical ([3-3]). Equations [3-1] to [3-3] have been proposed as a general mechanism for the reaction of chromium(VI) with thiols (21). Alternatively, the chromium(VI) thioester can be bound by another b-mercaptoethanol moiety, forming a bis-(b-mercaptoethanol)chromium(VI) complex ([3-4]). Thiyl radical can then attack this bis-(b-mercaptoethanol)chromium(VI) complex to form a b-mercaptoethanol-chromium(V) complex and oxidized b-mercaptoethanol ([3-5]). Alternatively, the bis-(b-mercaptoethanol)chromium(VI) complex can be reduced by another molecule of b-mercaptoethanol, forming a bis-(b-mercaptoethanol)chromium(V) complex and thiyl radical ([3-6]). The b-mercaptoethanol-chromium(V) complex formed by steps [3-2] or [3-5] can also be bound by another b-mercaptoethanol molecule to form the bis-(b-mercaptoethanol)chromium(V) complex ([3-7]). Both the mono-chelated b-mercaptoethanol-chromium(V) ([3-2,5]), and the bis-(b-mercaptoethanol)chromium(V) complexes ([3-6,7]) will be visible in the EPR spectrum, and may account for the two chromium(V) species observed in these reactions. Loss of the chromium(V) signal may be achieved by either reaction of the bis-(b-mercaptoethanol)chromium(V) complex with thiyl radical to form a b-mercaptoethanol-chromium(IV) complex (which is EPR silent) and oxidized b-mercaptoethanol ([3-8]), or by further reduction of bis-(b-mercaptoethanol)chromium(V) by additional b-mercaptoethanol molecules ([3-9]). Also, the mono-chelated b-mercaptoethanol-chromium(V) complex can react with thiyl radical to form chromium(IV) and oxidized b-mercaptoethanol ([3-10]). Thus, according to this proposed series of reactions, it is possible for thiyl radical to react with chromium(V) species and thus render them EPR silent. This is consistent with the increase in chromium(V) concentration, and its persistence in solution, when thiyl radical is effectively removed from solution.Recently, Shi et al. (59) have reported that desferoxamine (DES) (4.0 mM), when added to a phosphate-buffered (pH 7.2) reaction mixture containing K2Cr2O7 (40.0 mM Cr(VI)), NADPH (0.50 mM), and glutathione reductase, results in a decrease in the chromium(V) signal observed in the EPR spectrum, relative to the reaction performed in the absence of DES. They also show that DES decreases the formation of hydroxyl radical in the reaction, as evidenced by the decrease in DMPO-OH signal intensity in the presence of DES (59). They also report similar results using either EDTA or DETAPAC as the chelating agent. These findings do not contradict those reported here, however, since the chromium(V)-generating system employed in the study by Shi et al. (59) does not involve a thiol. The increase in chromium(V) concentration effected by DES or DETAPAC in the
b-mercaptoethanol/chromium(VI) system is most probably due to trapping of thiyl radical formed during the formation of chromium(V), thus making it unavailable to react further with chromium(V). The mechanism by which DES decreases both •OH and chromium(V) formation in the studies reported by Shi et al. (59) is not known.When the reaction of chromium(VI) and
b-mercaptoethanol in the presence of DETAPAC and DMPO was performed in the absence of molecular oxygen, a slight increase in chromium(V) formation (23.7%) was observed, while a large increase in thiyl radical formation (61.2%) was observed. The chromium(V) species formed in the absence of oxygen (g = 1.988, DH = 1.95 G; g = 1.986) are identical to those formed in the presence of oxygen, except for signal intensity. These data implicate oxygen, most likely reactive oxygen species such as hydroxyl radical (•OH), in the mechanism of chromium(V) formation and decay. However, since the chromium(V) and thiyl radical species did not increase by the same amounts in the absence of oxygen, any reactive oxygen species must react differently with various species in solution. It is proposed that any •OH radical formed in these reactions must preferentially react with RS• radical vs. chromium(V) species. This would account for the larger increase in thiyl radical in the absence of molecular oxygen. It is probable that under the conditions employed any •OH formed would react with RS• prior to reaction with DMPO. Thus, one would expect to see very little DMPO-OH radical adduct signal in the EPR spectra, and this is the case in these reactions.Since the DMPO-SR and DMPO-OH radical adduct signals appear in the same region of the EPR spectrum, a computer simulation was performed to determine whether •OH was formed in the reactions done in the presence of molecular oxygen. It is clear from the spectra in Figure 3-15 that in the aerobic system hydroxyl radical is a very minor component of the reaction (<10% of radical species is •OH). The radical adducts observed during the anaerobic reactions are even more predominantly thiyl radical, since the experimental spectrum is most closely fit by addition of much less than 10% thiyl radical.
It is interesting that addition of 0.24 mM iron to the reactions in the presence of DETAPAC (0.48 mM) resulted in the highest levels of chromium(V) (2X those observed in the absence of iron). Also, the DMPO-SR radical signal decreased at this iron concentration, relative to the absence of added iron. As the iron concentration was increased further (0.48 mM), the chromium(V) concentration decreased while the DMPO-SR signal increased. The iron concentration used in these studies (up to 0.48 mM) was much higher than trace levels ( in the µM range), and the effects appear to be stoichiometric rather than catalytic. Thus, it is clear that iron does not play any significant role in the reaction between
b-mercaptoethanol and chromium(VI), under the conditions employed in this study. However, it is interesting that the chromium(V) and DMPO-SR signals follow opposite trends upon addition of iron. When the DMPO-SR signal is high, the chromium(V) signal is low. This is again consistent with the hypothesis that thiyl radical can react with chromium(V), effectively rendering it EPR silent; increased thiyl radical levels should result in decreased chromium(V) levels, and this was observed in these reactions.3.1.1.4. Summary of the Reduction of Chromium(VI) by
b-mercaptoethanolIn summary, the reaction of potassium dichromate with
b-mercaptoethanol in 50 mM Tris-HCl, pH 7.0 resulted in the formation of two chromium(V) species (gav = 1.988, 1.986), and a b-mercaptoethanol-thiyl radical. At high (20:1) thiol:chromium ratios there was 23.0% conversion of chromium(VI) to chromium(V) in the absence of DNA, and 60.4% conversion to chromium(V) in the presence of DNA or the chelating agents DETAPAC or DES. The presence of the spin-trap DMPO not only allowed for the detection of thiyl radical, but also served to increase the levels of chromium(V) observed. The formation and decay of chromium(V) species was also accelerated at high thiol:chromium ratios in the absence of DNA. However, the presence of DNA significantly altered the time-courses for these reactions, and over a 30 minute time period the chromium(V) concentration is still increasing at all b-mercaptoethanol:Cr ratios except 20:1. This trend in the time-course of the chromium(V) signal in the presence of DNA is consistent with the removal of reactive radical species from solution by DNA. It has also been shown that the ultimate fate of the chromium species in these reactions is a b-mercaptoethanol-chromium(III) species. This is most clearly evidenced by the similar EPR spectra obtained either via reduction of chromium(VI) by b-mercaptoethanol (as evidenced at 24-hour time points) or via substitution of H2O ligands on hexaaquochromium(III) by b-mercaptoethanol ligands.3.1.2. Reaction of Chromium(VI) with Dithiothreitol
The reaction of potassium dichromate, K
2Cr2O7, (0.48 mM chromium(VI)) with dithiothreitol at pH 7.0 and 37 °C resulted in the formation of moderate amounts (up to 72 µM; 15% of total chromium) of relatively short-lived chromium(V) species, with g^ = 1.984, and g// = 2.001 or g// = 2.012 (gav, calc. = 1.990 or 1.993; DH = 15.8 G) (Figure 3-19). The amount of chromium(V) formed depended on the amount of thiol present, with a 20:1 ratio of thiol to chromium effecting the highest concentration of chromium(V) (72 µM) (Figure 3-19). A time course showing absolute chromium(V) concentration (as compared to a K3CrO8 standard of known concentration) as a function of time for all ratios is shown in Figure 3-20. For the 20:1 ratio (9.6 mM dithiothreitol : 0.48 mM Cr(VI)), the chromium(V) species observed reached a maximum concentration about 3 minutes into the reaction and decayed relatively quickly with time. For the 10:1 ratio (4.8 mM dithiothreitol : 0.48 mM Cr(VI)), the chromium(V) species observed reached a maximum concentration about 6 minutes into the reaction and decayed more slowly with time. The 5 and 5:1 ratios also reached a maximum chromium(V) concentration about 6 minutes into the reaction, and decayed only slightly with time. For all ratios, a small amount chromium(V) was detected 30 minutes after the start of the reaction (~2 µM). Figure 3-21 shows the typical broad 77K chromium(III) signals observed at later time points in these reactions.The ultimate fate of the chromium in these reactions is a chromium(III) species. It is interesting to note that a mixture of hexaaquochromium(III) (480 µM) and dithiothreitol (1:20 ratio) results in a multi-featured spectrum (g = 1.778; 1.854; 1.972,
DH = 129.03; 1.986; 2.004; 2.072; 2.219) very different from the starting hexaaquochromium(III) spectrum (g = 1.980, DH = 138 G; Figure 3-21) in only 5 minutes. After 24 hours, the spectrum is nearly identical to that of the reaction of chromium(VI) (480 µM) with dithiothreitol (1:20 ratio) also incubated for 24 hours (g = 1.972, DH Å 280 G; Figure 3-21). Opening the spectral window in this reaction by using a sweep width of 5000 Gauss revealed no new features in the spectra. There was no change in the spectra with further incubation after 24 hours, indicating that the final, thermodynamic product in both cases (ligand substitution on chromium(III) and reduction of chromium(VI)) is the same.In the reaction of hexaaquochromium(III) with dithiothreitol, it is clear that ligand substitution on the chromium(III) center has occurred as evidenced by the dramatic presentation of new features in the EPR spectrum (Figure 3-21). Stock hexaaquochromium(III) (Figure 3-21) shows no change over time, while introduction of dithiothreitol results in 6 new features in the spectrum within 5 minutes, and retention of 3 of these features after 24 hours (Figure 3-21).
3.1.2.1. Discussion
The most important structural feature these spectra reveal is that the chromium(V) species formed have an axial geometry, as evidenced by the g
^ = 1.984, and g// = 2.001 or g// = 2.012 spectral features (Figure 3-19). For all ratios of dithiothreitol:chromium, more than one chromium(V) species is formed, as evidenced by the presence of two axial signals at g// = 2.001 and g// = 2.012. The value of g^ (1.984) is nearly identical for both species formed, and only a very small shoulder on the g^ signal is present. This shoulder is most pronounced at higher dithiothreitol:chromium ratios, and coalesces into a single feature at lower thiol:chromium ratios (Figure 3-19). Also, at higher dithiothreitol:chromium ratios the two axial components of the spectra (g// = 2.001 and g// = 2.012, originating from separate species) are much more pronounced, indicating the presence of two distinct species. However, as the ratio of dithiothreitol:chromium is decreased, the g// = 2.012 component of the spectrum becomes much less pronounced (Figure 3-19). Also, as the ratio of dithiothreitol:Cr is decreased, the intensity of the g// = 2.001 signal relative to the g^ = 1.984 signal increases (g///g^ = 0.47, 0.65, 0.68, 1.14 for 20, 10, 5, and 3:1 dithiothreitol:Cr ratios, respectively). One can infer from these data a mechanism whereby initially a single dithiothreitol moiety binds to chromium in a bidentate fashion (III):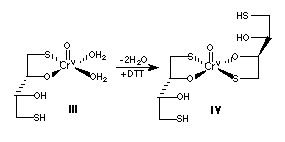 . At higher thiol concentrations, another molecule of dithiothreitol is bound to chromium (IV), and the second axial signal (g// = 2.012) is seen to increase in intensity. The time course for the formation and decay of chromium(V) species (Figure 3-20) is accelerated at higher thiol:chromium ratios, consistent with this mechanism. At higher thiol:chromium ratios, the formation of bis-dithiothreitol chromium(V) species is more favored, resulting in higher chromium(V) levels. However, the reduction of chromium(V) should also be accelerated when excess dithiothreitol is available, and this is observed at higher thiol:chromium ratios.
Over time (typically within 60-120 minutes), the chromium(V) signals observed in the EPR spectra decay, and a broad signal indicative of a chromium(III) species predominates. Unlike the
b-mercaptoethanol chromium(III) spectra discussed above, the dithiothreitol-chromium(III) spectra display more features. Twenty-four hour reactions of either chromium(III) or chromium(VI) with dithiothreitol result in very similar EPR spectra, indicating that the products of both reactions are similar.3.1.2.2. The Reaction of Chromium(VI) with Dithiothreitol in the Presence of DNA
The reaction of potassium dichromate, K
2Cr2O7, (0.48 mM chromium(VI)) with dithiothreitol (9.6 mM) at pH 7.0 and 37 °C in the presence of double-stranded calf thymus DNA (CT DNA) (0.048 mM) resulted in the formation of moderate amounts (up to 72 µM; 15% of total chromium) of relatively short-lived chromium(V) species, with g^ = 1.984 (DH = 15.45 G), and g// = 2.000 or g// = 2.010 (gav, calc. = 1.989 or 1.993) (Figure 3-22). The amount of chromium(V) formed depended on the amount of thiol present, with a 20:1 ratio of thiol to chromium effecting the highest concentration of chromium(V) (72 µM) (Figure 3-22). A time course showing absolute chromium(V) concentration (as compared to a K3CrO8 standard of known concentration) as a function of time for all ratios is shown in Figure 3-23. For the 20:1 ratio (9.6 mM dithiothreitol : 0.48 mM Cr(VI)), the chromium(V) species observed reached a maximum concentration about 3 minutes into the reaction and decayed with time. A small amount chromium(V) was detected 30 minutes after the start of the reaction (~2 µM) (Figure 3-23). In contrast to the studies involving b-mercaptoethanol, the presence of DNA in these reactions resulted in lower total chromium(V) formation than in the presence of DNA, at least for 10,5,3:1 ratios. It is also apparent from these data that the kinetics of the reactions are changed in the presence of DNA, with maximal levels of chromium(V) generally occurring earlier in the presence of DNA (Figure 3-23).Figure 3-24 shows the spectra obtained from the reaction of chromium(VI) (0.48 mM) with dithiothreitol (9.6 mM) at pH 7.0 and 37 °C in the presence of poly(dG) (0.048 mM). The lineshape and g-values obtained in the presence or absence of added polynucleotide are not significantly different. However, as is the case of added CT DNA, in the presence of poly(dG) significantly lower levels of chromium(V) were produced than in the absence of polynucleotide (Figure 3-25).
3.1.2.2.1 Discussion
The EPR spectra of the reaction of chromium(VI) (0.48 mM) with dithiothreitol (1.44-9.6 mM) observed in the presence of DNA are similar to those observed in the absence of DNA (g
^ = 1.984, DH = 15.54-15.8 G and g// = 2.002). In terms of spectral lineshape and g-values, the spectra observed in the presence of DNA do not differ significantly from those obtained in the absence of DNA. Again, the most important structural feature these spectra reveal is that the chromium(V) species formed have an axial geometry, as evidenced by the g^ = 1.984 (DH = 15.54 G), and g// = 2.000 or g// = 2.010 spectral features (Figure 3-22). For all ratios of dithiothreitol:chromium, it is apparent that more than one chromium(V) species is formed, as evidenced by the presence of two axial signals at g// = 2.000 and g// = 2.010. The value of g^ (1.984) is nearly identical for both species formed, and only a very small shoulder on the g^ signal is present. This shoulder is most pronounced at higher dithiothreitol:chromium ratios (Figure 3-22), and coalesces into a single feature at lower thiol:chromium ratios (Figure 3-22). Also, at higher dithiothreitol:chromium ratios the two axial components of the spectra (g// = 2.000 and g// = 2.010, originating from separate species) are much more pronounced, indicating the presence of two distinct species. However, as the ratio of dithiothreitol:chromium is decreased, the g// = 2.010 component of the spectrum becomes much less pronounced (Figure 3-22). As was observed for the reactions done in the absence of DNA, the ratio of (g// = 2.002/g^ = 1.984) decreases as the ratio of dithiothreitol:Cr increases. This is again consistent with a mechanism where initially a mono-(dithiothreitol)-chromium(V) complex is formed, and a second molecule of dithiothreitol subsequently binds to the chromium(V) center forming a bis-(dithiothreitol)-chromium(V) complex.The time-course for the formation and decay of chromium(V) species formed in the reaction of chromium(VI) with dithiothreitol in the presence of DNA follows the same trend as reactions done in the absence of DNA (Figure 3-23). However, at the 10,5, or 3:1 ratios of dithiothreitol:Cr, the chromium(V) levels produced in the presence of DNA are lower than those levels produced in the absence of DNA. The reason for the lower chromium(V) levels produced in the presence of DNA is not understood; the EPR spectra observed either in the presence or absence of DNA differ only in the intensities of the chromium(V) signals. It is unlikely that DNA is reacting with the dithiothreitol-chromium(V) complexes, as the EPR spectra observed are almost identical, and the time-courses differ only in intensity, not in shape (Figure 3-23). Also, the time-courses observed at the highest dithiothreitol:Cr ratio (20:1) are identical.
3.1.2.3. Summary of the Reduction of Chromium(VI) by Dithiothreitol
In summary, the reaction of chromium(VI) with dithiothreitol resulted in the formation of more than one chromium(V) species, and at high (20:1) thiol:chromium ratios there was 15% conversion of chromium(VI) to chromium(V). The formation and decay of chromium(V) species was also accelerated at high thiol:chromium ratios. It has also been shown that the ultimate fate of the chromium species in these reactions is a dithiothreitol-chromium(III) species. This is most clearly evidenced by the similar EPR spectra obtained either via reduction of chromium(VI) by dithiothreitol (as evidenced at 24-hour time points) or via substitution of H
2O ligands on hexaaquochromium(III) by dithiothreitol ligands. The presence of DNA in these reactions appears to attenuate overall chromium(V) signal levels at lower dithiothreitol:Cr ratios, but does not effect the time-courses observed.3.1.3. Reaction of Chromium(VI) with Glutathione
The reaction of potassium dichromate, K
2Cr2O7, (0.48 mM chromium(VI)) with glutathione at pH 7.0 and 37 °C resulted in the formation of small amounts (up to 5 µM; 1% of total chromium) of relatively long-lived chromium(V) species, with g^ = 1.991 , and g// = 2.005 or g// = 2.017 (gav, calc. = 1.996 or 2.000, DH = 10.7 G) (Figure 3-26). A time course showing absolute chromium(V) concentration (as compared to a K3CrO8 standard of known concentration) as a function of time for all ratios is shown in Figure 3-27. The amount of chromium(V) formed was highly dependent on the amount of thiol present, with a 20:1 ratio of thiol to chromium effecting the highest concentration of chromium(V) (5 µM). For the 10 or 20:1 ratios (4.8-9.6 mM glutathione : 0.48 mM Cr(VI)), the chromium(V) species observed reached a maximum concentration about 5 minutes into the reaction and slowly decayed with time (Figure 3-27). A small amount chromium(V) was detected 30 minutes after the start of the reaction (~2 µM for 20:1 and ~1 µM for 10:1 ratios). At the 3 or 5:1 glutathione:chromium(VI) ratios, the chromium(V) species observed also reached a maximum concentration about 5 minutes into the reaction (~0.5 and 0.75 µM for 3 and 5:1 ratio, respectively), but then remained fairly constant for 30 minutesThe ultimate fate of the chromium in these reactions is a chromium(III) species. Figure 3-28 shows the typical broad 77K chromium(III) signals observed at later time points in these reactions. A mixture of hexaaquochromium(III) (480 µM) and glutathione (1:20 ratio) resulted in a multi-featured spectrum (g = 2.225; 2.068; 1.990; 1.971,
DH = 152.5; 1.852) very different from the starting hexaaquochromium(III) spectrum (g = 1.980, DH = 138 G; Figure 3-28) in only 5 minutes. After 24 hours, the spectrum was nearly identical to that of the reaction of chromium(VI) (480 µM) with glutathione (1:20 ratio) also incubated for 24 hours (g = 2.042; 1.977, DH = 48.9 G; Figure 3-28). There was no change in the spectra with further incubation after 24 hours, indicating that the final, thermodynamic product in both cases (ligand substitution on chromium(III) and reduction of chromium(VI)) is the same.In the reaction of hexaaquochromium(III) with glutathione, it is clear that ligand substitution on the chromium(III) center has occurred as evidenced by the dramatic presentation of new features in the EPR spectrum (Figure 3-28). Stock hexaaquochromium(III) shows no change over time, while introduction of glutathione results in new features in the spectrum within 5 minutes; 2 of these features are retained (g = 1.990; 1.971) and a new feature (g = 2.042, also present in the reaction of chromium(VI)) is observed after 24 hours (Figure 3-28).
3.1.3.1. Discussion
The most important structural feature of the spectra observed during the reaction of chromium(VI) with glutathione is that the chromium(V) species formed have an axial geometry, as evidenced by the g
^ = 1.991, and g// = 2.005 or g// = 2.017 spectral features (Figure 3-26). For all ratios of glutathione:chromium, it is apparent that more than one chromium(V) species is formed, as evidenced by the presence of two axial signals at g// = 2.005 and g// = 2.017. The value of g^ (1.991) is identical for both species formed. At higher glutathione:chromium ratios the two axial components of the spectra (g// = 2.005 and g// = 2.017, originating from separate species) are much more pronounced, indicating the presence of two distinct species (Figure 3-26). However, as the ratio of glutathione:chromium is decreased, the g// = 2.017 component of the spectrum becomes much less pronounced, until it is no longer detectable at the lowest (3:1) ratio (Figure 3-26). An interesting feature in these spectra present at the high glutathione:chromium ratio (20:1) is evident at g = 1.979 (Figure 3-26). At this level of glutathione, the signal at g = 2.017 is the most intense, and a small signal at g = 1.979 is also evident. One can infer from these data that at higher glutathione concentrations, multiple species are present, and at least one species has some rhombic character (gx = 2.017, gy = 1.979, and gz = 1.991) and the other major species is axial (g^ = 1.991, and g// = 2.005).Consistent with the data presented is a mechanism for the formation of chromium(V) species which involves initially a single glutathione moiety bound to chromium in a bidentate fashion (V), attributed to the g
^ = 1.991, g// = 2.005 (gav = 1.996) EPR signal. At higher thiol concentrations, another molecule of glutathione is bound to chromium, resulting in a bis-(glutathione)-chromium(V) complex (VI), attributed to the g^ = 1.991, g// = 2.017 (gav = 2.000) EPR signal: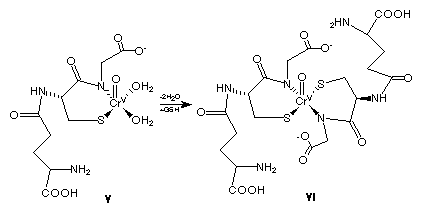 . Alternatively, in a mechanism similar to that proposed by Aiyar (48), it is possible that under the reaction conditions employed (0.48 mM chromium(VI)), the mono-(glutathione)chromium(V) signal is not observed, and the g
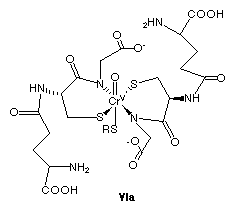 . This alternate mechanism is also consistent with these data, as the g
Over time (typically within 60-120 minutes), the chromium(V) signals observed in the EPR spectra decay, and a broad signal indicative of a chromium(III) species predominates. Twenty-four hour reactions of either chromium(III) or chromium(VI) with glutathione result in very similar EPR spectra, indicating that the products of both reactions are similar.
3.1.3.2. Reaction of Chromium(VI) with Glutathione in the Presence of DNA
The reaction of potassium dichromate, K
2Cr2O7, (0.48 mM chromium(VI)) with glutathione (9.6 mM, 20:1 glutathione:Cr ratio) in the presence of double-stranded calf thymus DNA (0.048 mM) at pH 7.0 and 37 °C resulted in the formation of small amounts (up to 3.4 µM; 0.71% of total chromium) of relatively long-lived chromium(V) species, with g^ = 1.991 (DH = 10.4 G), and g// = 2.000 (very minor) or g// = 2.017 (gav, calc. = 1.994 or 2.000) (Figure 3-29). A time course showing absolute chromium(V) concentration (as compared to a K3CrO8 standard of known concentration) as a function of time is shown in Figure 3-30. The chromium(V) species observed reached a maximum concentration about 5 minutes into the reaction and slowly decayed with time. A small amount chromium(V) was detected 30 minutes after the start of the reaction (~2 µM). Comparison with reactions done in the absence of DNA shows that the presence of DNA serves to slightly lower the chromium(V) levels observed, while not significantly affecting the kinetics of the reaction (Figure 3-30). Also, the presence of DNA in this reaction results in the loss of most of the g = 2.005 feature observed in the absence of DNA (Figure 3-29, insert).3.1.3.2.1 Discussion
The most important structural feature of the spectra observed during the reaction of chromium(VI) (0.48 mM)with glutathione (9.6 mM) in the presence of DNA (0.048 mM) is that the chromium(V) species formed have an axial geometry, as evidenced by the g
^ = 1.991, and g// = 2.017 spectral features (Figure 3-29). Unlike the spectra observed in the absence of DNA (Figure 3-26), there is only a very small signal attributable to another axial species, at g// = 2.000. Also, in the presence of DNA there is no detectable rhombic signal at a g value of about 1.980, in contrast to the reaction performed in the presence of DNA (Figure 3-26). The time-course for the formation and decay of the chromium(V) species in this reaction is very similar to that found in the absence of DNA, however the overall level of chromium(V) observed is lower in the presence of DNA. The time-courses in the presence or absence of DNA are similar, but the g// = 2.005 signal is significantly reduced in the presence of DNA. It is possible that the presence of DNA in the reaction makes the formation of the bis-(glutathione)-chromium(V) complex (VI) more favorable vs. the mono-(glutathione)-chromium(V) complex (V). This is consistent with the presence of an axial signal at g// = 2.017. (which has been assigned to a bis-(glutathione)-chromium(V) complex (VI)), and the loss of the g// = 2.005 signal (assigned to complex (V)).3.1.3.3. Summary of the Reduction of Chromium(VI) by Glutathione
In summary, the reaction of chromium(VI) with glutathione resulted in the formation of more than one chromium(V) species, and at high (20:1) thiol:chromium ratios there was 1.0% conversion of chromium(VI) to chromium(V). The formation and decay of chromium(V) species was also accelerated at high thiol:chromium ratios. It has also been shown that the ultimate fate of the chromium species in these reactions is a glutathione-chromium(III) species. This is most clearly evidenced by the similar EPR spectra obtained either via reduction of chromium(VI) by glutathione (as evidenced at 24-hour time points) or via substitution of H
2O ligands on hexaaquochromium(III) by glutathione ligands. The presence of DNA in these reactions appears to attenuate overall chromium(V) signal levels, but does not effect the time-courses observed.3.1.4. Reaction of Chromium(VI) with Cysteine
The reaction of potassium dichromate, K
2Cr2O7, (0.48 mM chromium(VI)) with cysteine at pH 7.0 and 37 °C resulted in the formation of very small amounts (up to 2.5 µM; 0.52% of total chromium) of relatively short-lived chromium(V) species, with g^ = 1.978 (DH = 20.9 Gauss), and g// = 1.993 (gav, calc. = 1.983, DH = 20.9 G) (Figure 3-31). A time course showing absolute chromium(V) concentration (as compared to a K3CrO8 standard of known concentration) as a function of time for all ratios is shown in Figure 3-32. The amount of chromium(V) formed depended on the amount of thiol present, with a 20:1 ratio of thiol to chromium effecting the highest concentration of chromium(V) (2.5 µM). For the 20:1 ratio (9.6 mM cysteine : 0.48 mM Cr(VI)), the chromium(V) species observed reached a maximum concentration about 5 minutes into the reaction and quickly decayed with time (Figure 3-32). For all cysteine:chromium(VI) ratios no chromium(V) was detected 30 minutes after the start of the reaction.The ultimate fate of the chromium in these reactions was a chromium(III) species. Figure 3-33 shows the typical broad 77K chromium(III) signals observed at later time points in these reactions. A mixture of hexaaquochromium(III) (480 µM) and cysteine (1:20 ratio) resulted in a multi-featured spectrum (g = 2.224; 2.073; 1.971,
DH = 129.0 G; 1.944; 1.854; 1.778; Figure 3-33) very different from the starting hexaaquochromium(III) spectrum in only 5 minutes. After 24 hours, the spectrum is nearly identical (g = 1.994, DH = 103.0 G) to that of the reaction of chromium(VI) (480 µM) with cysteine (1:20 ratio) also incubated for 24 hours (g = 1.994, DH = 102.6 G; Figure 3-33). There was no change in the spectra with further incubation after 24 hours, indicating that the final, thermodynamic product in both cases (ligand substitution on chromium(III) and reduction of chromium(VI)) was the same.Comparison of the EPR spectra of the reaction of chromium(VI) (480 µM) with cysteine (1:20 ratio, at 37 °C for 10 or 30 minutes; g = 4.713, 4.053, 3.167, 2.574, and 2.003) with the EPR spectrum of Na[Cr
III(L-Cys)2]•2H2O (synthesized by the method of De Meester et al. (56) as described in Methods) (g = 4.713, 4.053, 3.167, 2.574, and 2.003; Figure 3-34) revealed that the final product in the reduction of chromium(VI) by cysteine was a bis-cysteinate complex. Further evidence for a biscysteinate complex was shown by the similarity in electronic spectra of Na[CrIII(L-Cys)2]•2H2O (lmax = 406.0, 526.0, 600.0 nm) and the reaction mixture of potassium dichromate (0.48 mM chromium(VI)) and cysteine (9.6 mM; 20:1 thiol:Cr ratio; lmax = 411.5, 544.5, 611.7 nm) (Figure 3-35).
3.1.4.1. Discussion
The most important structural feature of the spectra observed during the reaction of chromium(VI) with cysteine is that the chromium(V) species formed have an axial geometry, as evidenced by the g
^ = 1.978, and g// = 1.993 spectral features (Figure 3-31). Also present in these spectra is a feature at g = 2.003 that is indicative of the cystine radical anion. For all ratios of cysteine:chromium, the level of chromium(V) formed is quite low, and spectral resolution (signal/noise ratio) is quite poor. However, it is apparent that only one chromium(V) species is present in any significant amount, as evidenced by the presence of a single axial signal at g// = 1.993. It is also evident that the intensity of the cystine radical anion feature at g = 2.003 tends to increase as the main chromium(V) signal decreases. This is most apparent at the lower cysteine:chromium ratios (Figure 3-31).The ultimate fate of chromium in these reactions is a bis-(cysteinate)chromium(III) complex, since the EPR spectrum for the reaction of chromium(VI) with cysteine (after 30 minutes) compares favorably to the EPR spectrum observed for Na[Cr
III(L-Cys)2]•2H2O. The formation and decay of the observed chromium(V) species is quite fast (Figure 3-32), thus the formation of a mono-(cysteinate)chromium(V) complex (VII) prior to the formation of a bis-(cysteinate)chromium(V) complex (VIII) cannot be confirmed, but is postulated: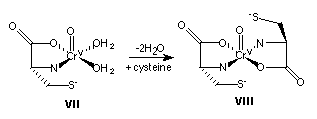 . The structures proposed for the mono- and bis-(cysteinate) complexes (VII and VIII) involve equatorial N,O ligation as opposed to complexes proposed for mono- and bis-(glutathione)chromium(V) (V and VI). The g-values for the glutathione complexes (g
3.1.4.2. Reaction of Chromium(VI) and Cysteine in the Presence of DNA
The reaction of potassium dichromate, K
2Cr2O7, (0.48 mM chromium(VI)) with cysteine (9.6 mM) in the presence of double-stranded calf thymus DNA (0.048 mM) at pH 7.0 and 37 °C resulted in the formation of small amounts (up to 1.8 µM; 0.37% of total chromium) of very short-lived chromium(V) species, with g^ = 1.980 (DH = 11.4 G), and g// = 1.997 (gav, calc. = 1.986) (Figure 3-36). A time course showing absolute chromium(V) concentration (as compared to a K3CrO8 standard of known concentration) as a function of time is shown in Figure 3-37. The chromium(V) species observed reached a maximum concentration about 2 minutes into the reaction and quickly decayed with time. Little or no chromium(V) was detected 15 minutes after the start of the reaction (< 0.1 µM). Comparison with reactions done in the absence of DNA showed that the presence of DNA serves to slightly lower the maximum chromium(V) levels observed (1.8 µM; 0.37 % of total chromium), while not significantly affecting the kinetics of the reaction (Figure 3-37).The most important structural feature these spectra revealed was that the chromium(V) species formed had an axial geometry, as evidenced by the g
^ = 1.981, and g// = 1.997 spectral features (Figure 3-36). Unlike the spectra observed in the absence of DNA (Figure 3-31), there was no significant signal attributable to the cystine radical anion, at g = 2.003, and the chromium(V) signal was more resolved in the presence of DNA. Comparison of the spectra obtained in the presence or absence of DNA clearly showed that in either case the final product is a bis-cysteinate chromium(III) complex (Figure 3-38). The features characteristic of the bis-cysteinate chromium(III) complex in the g = 2.5 to 6.5 region were clearly present with or without DNA, however the features were moderately broadened in the presence of DNA (Figure 3-38).3.1.4.2.1 Discussion
The most important structural feature of the spectra observed during the reaction of chromium(VI) (0.48 mM)with cysteine (9.6 mM) in the presence of DNA (0.048 mM) is that the chromium(V) species formed have an axial geometry, as evidenced by the g
^ = 1.981, and g// = 1.997 (gav = 1.986) spectral features (Figure 3-36). The EPR spectra observed are very similar to those observed in the absence of DNA. The time-course for the formation and decay of the chromium(V) species in this reaction is very similar to that found in the absence of DNA, however the overall level of chromium(V) observed is lower in the presence of DNA. The presence of DNA also serves to increase the resolution of the EPR spectra observed (Figure 3-36). The g^ = 1.981, and g// = 1.997 spectral features are attributed to the formation of a bis-(cysteinate)chromium(V) complex (VIII), by a reaction mechanism similar to the reaction performed in the absence of DNA.3.1.4.3. Summary of the Reduction of Chromium(VI) by Cysteine
In summary, the reaction of chromium(VI) with cysteine resulted in the formation of a bis-(cysteinate)chromium(V) complex, and at high (20:1) thiol:chromium ratios there was 0.5% conversion of chromium(VI) to chromium(V). The formation and decay of chromium(V) species was also accelerated at high thiol:chromium ratios. It has also been shown that the ultimate fate of the chromium species in these reactions is a bis-(cysteinate)chromium(III) complex. This is most clearly evidenced by the similar EPR spectra obtained from the reduction of chromium(VI) by cysteine (at 30-minute time points) and Na[Cr
III(L-Cys)2]•2H2O. The presence of DNA in these reactions appears to attenuate overall chromium(V) signal levels, but does not effect the time-courses or EPR g-values observed.3.1.5. Summary of Reduction of Chromium(VI) by Thiols
Four thiols were used in this study,
b-mercaptoethanol, dithiothreitol, glutathione, and cysteine, in order to determine differences in their reactions with chromium(VI). In particular, the formation of chromium(V) and chromium(III) species was followed via EPR spectroscopy. Table 3-2 summarizes the EPR data obtained from the experiments discussed above. These experiments have revealed important structural and rate information on the chromium species formed during these reactions. Specifically, all chromium(V) species observed displayed EPR spectra indicative of complexes possessing axial geometries. In reactions involving glutathione at a 20:1 glutathione:chromium(VI) ratio, some EPR features characteristic of a rhombic complex were also observed. It has been shown that the reduction of chromium(VI) by cysteine and glutathione is very fast, with most of the chromium(VI) reduced to chromium(III) within 2 minutes, and very little chromium(V) is detectable. Reduction of chromium(VI) by b-mercaptoethanol or dithiothreitol, however, proceeds much more slowly, and relatively large levels of chromium(V) are detectable.In a separate study, the reactions of the four thiols were repeated in the presence of calf-thymus DNA. The most striking difference in the reaction of chromium(VI) with thiols (
b-mercaptoethanol, dithiothreitol, glutathione, or cysteine) in the presence of DNA as compared to those done in the absence of DNA is the large increase in chromium(V) concentration seen over time, especially when b-mercaptoethanol was used as the reducing agent. The presence of DNA in reactions involving b-mercaptoethanol seemed to enhance the stability of the chromium(V) complexes formed and allowed them to reach much higher concentrations.Table 3-2. Chromium(V) complexes formed during the reduction of Chromium(VI) by thiols.a
|
g av (calc)b |
D H (G)c |
g ^ |
g // |
Thiol d |
Geometry |
Buffer e |
Comments |
|
|
1.991 |
17.2 |
1.985 |
2.003 |
b -ME |
Axial |
Tris |
23% Cr(V) formation for 20:1 thiol:Cr ratio |
|
|
1.983 |
shoulder |
|||||||
|
1.990 |
15.8 |
1.984 |
2.001 |
DTT |
Axial |
Tris |
8.7% Cr(V) formation for 20:1 |
|
|
1.993 |
1.984 |
2.012 |
Shoulder on g ^ at 20:1; g// is of low intensity at low ratios |
|||||
|
1.996 |
10.7 |
1.991 |
2.005 |
GSH |
Axial |
Tris |
1% Cr(V) formation for 20:1 |
|
|
2.000 |
1.991 |
2.017 |
g // not detectable at low ratios |
|||||
|
1.996 |
1.991 (g y)1.979 (g z) |
2.017 (g x) |
Rhombic |
Tris |
only detectable at 20:1 |
|||
|
1.983 |
20.9 |
1.978 |
1.993 |
CYS |
Axial |
Tris |
0.5% Cr(V) formation for 20:1 |
|
|
2.003 |
- |
- |
- |
Cystine radical anion |
||||
a
0.48 mM Cr(VI), 1.44-9.6 mM thiol; bgav = (2(g^) + g//)/3; cLinewidth, peak-trough, of major Cr(V) signal; db-ME = b-mercaptoethanol, DTT = dithiothreitol, GSH = glutathione, CYS = cysteine; epH = 7.0, 37 °C.3.1.6. Comparison of the Chromium(III) Products Formed During the Reaction of Chromium(VI) or Chromium(III) with Thiols
3.1.6.1. Chromium(III) vs. Chromium(V) EPR Spectroscopy
Chromium(V), a d
1 system, typically displays sharp (10-30 Gauss) 77K EPR spectra in the g = 1.95-2.05 region, while d3 chromium(III) systems characteristically display very broad (100-200 Gauss), nondescript spectra in this region. The main reason for this difference in EPR spectra is the difference in the total spin of the systems. Chromium(V) species have S = 1/2, while chromium(III) species have S=3/2. When such species containing unpaired electron(s) are placed in a magnetic field, the initially degenerate energy levels are split via interaction of the unpaired electron magnetic moment with the magnetic field (the electronic Zeeman effect). An EPR transition occurs when a species absorbs energy (n Å 109 Hz) equal to the energy difference between levels due to the Zeeman effect. For systems with a total spin greater than S = 1/2, an effect known as zero-field splitting also occurs, resulting in the splitting of the energy levels even in the absence of a magnetic field (and corresponding to a zero field splitting constant, D). Figure 3-39 shows a theoretical energy-level diagram for an S=3/2 system (60). In the presence of a magnetic field, the energy levels are split, and due to the zero-field splitting, the DMs = 1 transitions occur at different values of the applied field for a given microwave frequency (as shown by the arrows in Figure 3-39) (60). The zero field splitting, D, is often larger than the Zeeman energy for many chromium(III) complexes, Thus, it is not always possible to observe all the DMs = 1 transitions, specifically if the zero field splitting is larger than the available microwave quantum (hn) (60). It should also be noted that another important factor must be taken into account when dealing with chromium(III) (and transition metals in general), namely Kramer's rule. This rule states that electrostatic interactions cannot completely remove the degeneracy of a system with an odd number of electrons (60). Therefore, a system with S = 1/2, 3/2, 5/2 etc. must always have at least doubly degenerate ground spin state (in the absence of an applied magnetic field); these zero field doublets are called Kramer's doublets. Thus, for S = 1/2 systems it is in principle always possible to observe at least one EPR transition.For chromium(III) species in an octahedral field, the zero field splitting is greatly affected by the ligands bound to the chromium(III) center, as well as by the overall geometry of the complex. Very often the zero field splitting constant, D, is greater than the available microwave energy, and the two Kramer's doublets, +1/2 and +3/2, are well separated in energy, and transitions between them are no longer possible with a typical X-band spectrometer. Thus, chromium(III) EPR spectra often manifest themselves as very broad, "featureless" spectra, except in those cases where the ligands and geometry about the chromium(III) center result in a zero field splitting less than h
n.3.1.6.2. Chromium Reactions with Thiols
The ultimate fate of chromium(VI) species in the presence of thiol reducing agents has been shown to be various chromium(III) species. For all four thiols studied,
b-mercaptoethanol, dithiothreitol, glutathione, and cysteine, the chromium(V) signals observed in the EPR spectra decay over time (typically within 60-120 minutes), and very broad signals indicative of chromium(III) species predominate. It is of interest to note that reactions performed under similar conditions with chromium(III) as the initial form of chromium result in EPR spectra very similar to those where chromium(VI) was the initial form of chromium. Table 3-3 summarizes EPR spectral data for these reactions.As indicated in Table 3-3, the reactions involving
b-mercaptoethanol resulted in relatively featureless EPR spectra, but nonetheless both the chromium(III) and chromium(VI) reactions ultimately resulted in similar spectra. Reactions involving dithiothreitol displayed several prominent features, with either chromium(III) or chromium(VI) as the initial form of chromium (Table 3-3). Similarly, both glutathione and cysteine effected multi-featured EPR spectra. Again, the spectra observed when chromium(III) was the initial form of chromium were very similar to those observed when chromium(VI) was the initial form.A striking feature of the reactions where chromium(III) was the initial form of chromium is that those reactions involving the larger thiol moieties (dithiothreitol, glutathione, cysteine; see Figure 3-1) all display very similar spectra within 5 minutes after the start of the reactions (Figure 3-40, Table 3-3).
b-mercaptoethanol, on the other hand, effects a broad, featureless EPR spectrum upon reaction with chromium(III). It is clear from the EPR spectral data that ligand substitution is occurring on the initial hexaaquochromium(III) species, since radically new features are observed upon addition of thiol (or, as in the case of b-mercaptoethanol, there is a significant loss of signal intensity). The persistence of these new species is evident by the retention of many of these features in the EPR spectra over a 24-hour time period.It is remarkable that dithiothreitol and glutathione display almost identical EPR spectra when incubated with chromium(III), although the probable ligating groups for the two thiols are different (S,N for glutathione; S,O for dithiothreitol; Figure 3-1). Since both geometry and ligating groups have a great effect on the presentation of chromium(III) EPR spectra, it is perhaps not so surprising that the chromium(III) EPR spectra of dithiothreitol and glutathione are so similar. It is possible that for glutathione there is trans-S and cis-N,O ligation about octahedral chromium(III) center (Figure 3-41). This proposed structure is similar to that proposed by Abdullah et al. (61), which involves coordination of the chromium(III) center by the S of the cysteinyl portion of glutathione and the N,O of the adjacent glycinyl portion. It is likely that upon reduction of the bis-(glutathione)chromium(V) complex (VI) to a bis-(glutathione)chromium(III) complex (Figure 3-41) equatorial ligation of S,N is retained, and carboxylate oxygens from the glycine portions of glutathione bind in the remaining 5th and 6th positions of the octahedral chromium(III) center. Similarly, it is possible that for dithiothreitol there are S and O ligands in the equatorial positions, and an O ligand in the axial position(s) (Figure 3-41). However, the EPR spectrum observed in the case of dithiothreitol persisted for 24 hours, while that of glutathione decayed with time so that at 24 hours only a single feature was observed. A possible explanation for the changes in the EPR spectrum for the glutathione reaction can be postulated based on recent work by Bose et al. (62). These authors have indicated that the final product of the reaction of chromium(VI) with glutathione (at acidic pH) may be a dinuclear chromium(III) product containing one molecule of oxidized glutathione (GSSG) and two molecules of glutathione (GS
-) per dimer. This complex may also be formed at higher pH. In the present studies, the initial chromium(III) EPR spectrum for the glutathione reaction is postulated to be due to a bis(glutathione)chromium(III) complex (Figure 3-41-C). Over time, the formation of the dinuclear chromium(III) product, (GS-)CrIII-GSSG-CrIII(GS-), may occur, resulting in a loss of EPR spectral resolution and signal intensity due in part to a change in the geometry about the chromium(III) center(s) and to some antiferromagnetic coupling between the two chromium(III) centers. b-mercaptoethanol cannot bind in a tridentate manner like dithiothreitol or glutathione, so the open positions on the chromium(III) center are filled by solvent molecules (H2O) (Figure 3-41). It is probable that exchange of solvent molecules in these positions takes place at a fast rate relative to the EPR time-scale, which results in a broad, featureless spectrum for theTable 3-3. EPR spectral parameters for chromium(III) complexes formed upon reaction of chromium(III)/chromium(VI) with thiols.
|
Initial chromium a |
Thiol b |
Time |
g |
D H (G) |
Comments |
|
Cr(III) |
- |
- |
1.980 |
138 |
Cr(NO 3)3•9H2O (initial) |
|
Cr(III) |
b- ME |
24 h |
1.980 |
~200 |
very broad, featureless spectrum- difficult to determine linewidth accurately |
|
Cr(VI) |
b- ME |
30 m |
1.980 |
~200 |
Intense Cr(V) signal makes it difficult to determine linewidth of Cr(III) species accurately. |
|
Cr(VI) |
b- ME |
24 h |
1.980 |
~180 |
very broad, featureless spectrum- difficult to determine linewidth accurately |
|
Cr(III) |
DTT |
5 m |
1.972 2.219 2.072 1.986 1.854 1.778 |
129.0 |
Multi-featured spectrum. Most features persist for 24 hours at room temp. |
|
Cr(VI) |
DTT |
24 h |
1.973 |
131.0 |
Broad spectrum |
|
Cr(III) |
GSH |
5 m |
1.971 2.225 2.068 1.990 1.852 |
152.5 |
Multi-featured spectrum. |
|
Cr(III) |
GSH |
24 h |
1.977 2.042 |
~50 |
Low-intensity signal |
|
Cr(VI) |
GSH |
24 h |
1.977 2.042 |
48.9 |
More intense signal than for the Cr(III) reaction, but same features. |
|
Cr(III) |
CYS |
5 m |
1.971 2.224 2.073 1.994 1.854 1.778 |
129.0 |
Multi-featured spectrum. Most features persist for 24 hours at room temp. |
|
Cr(VI) |
CYS |
24 h |
1.994 4.713 4.053 3.167 2.574 |
102.6 |
shoulder at g ~1.996 features in g = 2.5-5 region are identical to those observed for Na[Cr(L-Cys) 2]•2H2O |
a
Cr(III) = Cr(NO3)3•9H2O, Cr(VI) = K2Cr2O7; bb-ME = b-mercaptoethanol, DTT = dithiothreitol, GSH = glutathione, CYS = cysteine.chromium(III)-
b-mercaptoethanol species.The final product of the reaction of chromium(III) with cysteine has been shown to be a bis-cysteinate complex, based on EPR and electronic spectra (Section 3.1.4), and the crystal structure of this complex has been reported by De Meester et al. (56) (Figure 3-42). Both the bis-cysteinate complex synthesized by the method of De Meester et al. (56), and the product of the reaction of chromium(III) with cysteine (Section 3.1.4) are quite stable over time (the EPR spectrum does not change with time),
The crystal structure of the bis-cysteinate complex reported by De Meester et al. (56) clearly shows that the axial ligand (S) is in a stable 5-membered ring structure. This compares favorably with the proposed structure for the chromium(III)-dithiothreitol complex formed upon incubation of hexaaquochromium(III) with dithiothreitol. Both the dithiothreitol and cysteine complexes are relatively stable over time, as evidenced by EPR spectroscopy.
3.1.7. Correlation of Chromium(V) Formation with Chromium-DNA Binding During the Reaction of Chromium(VI) with Thiols
Studies in this laboratory have shown that reduction of chromium(VI) in the presence of thiols in vitro leads to chromium-DNA adduct formation (63). The incubation of chromium(VI) (0.48 mM) with supercoiled or linearized pBR322 DNA (0.048 mM) in the presence of thiol reducing agents at pH 7.4 and 37 °C ultimately led to chromium binding to DNA (63). Reduction of chromium(VI) by dithiothreitol,
b-mercaptoethanol, glutathione, or cysteine in the presence of DNA led to binding of chromium to DNA; however, the level of chromium bound per DNA-nucleotide (Cr/DNA-P) depended upon the particular thiol used to reduce chromium(VI), the ratio of chromium to thiol in the reaction mixture, and the initial conformation of the DNA (63). The binding levels followed the order: dithiothreitol > b-mercaptoethanol >> glutathione > cysteine. The levels of binding for dithiothreitol and b-mercaptoethanol are ~1000-fold higher than for glutathione or cysteine. These results suggest that chromium species with different reactivities toward DNA are probably being produced during chromium(VI) reduction by the various thiols.The EPR studies reported in section 3.1 suggest that chromium(V) species are the important species that lead to binding of chromium to DNA. It is shown that the levels of chromium(V) formed in the presence of the four thiols studied is related to the amount of chromium bound to DNA in the presence of these thiols. Dithiothreitol and
b-mercaptoethanol produced very high levels of chromium-DNA adducts and also produced high levels of chromium(V), whereas much lower levels of both chromium-DNA adducts and chromium(V) were produced with glutathione and cysteine. Dithiothreitol effected the highest levels of chromium-DNA binding, but produced less chromium(V) than b-mercaptoethanol. It is possible that the chromium(V)-thiol species produced by the two thiols have a different reactivity toward DNA. While ß-mercaptoethanol effects the highest absolute levels of chromium(V), the chromium(V) species formed are relatively stable compared to the chromium(V) species formed by dithiothreitol, and higher DNA-binding is thus effected by dithiothreitol. The chromium(V) species formed by cysteine seem to be even less stable than the species formed by any of the other thiols, as evidenced by rapid decay to chromium(III) species. This reactivity, coupled with the low absolute levels of chromium(V) formed in the cysteine and glutathione reactions, can account for the low DNA-binding effected by these thiols.The thiols used in this study vary in structure and differ in pK
a, features known to influence their reaction with chromium(VI). Proposed structures of the chromium(V)-thiol complexes formed in these reactions involve a square-pyramidal chromium(V) [Cr=O]3+ complexes possessing axial symmetry (Figure 3-1) (48). The oxochromium(V) complexes formed by dithiothreitol and ß-mercaptoethanol are thought to involve coordination of sulfur and oxygen ligands in a bidentate fashion, similar to that of an oxochromium(V) complex with 2-mercaptobenzoic acid (64). The oxochromium(V) complexes formed by cysteine and glutathione are thought to involve coordination of sulfur and nitrogen ligands in a bidentate fashion, similar to that of an oxochromium(V) complex with dithizone (65).The nature of the chromium(III) products formed upon thiol reduction may also influence the chromium-DNA interaction. The dithiothreitol and ß-mercaptoethanol reactions show large amounts of chromium(V) and very low levels of EPR-detectable chromium(III). The glutathione and cysteine reactions show very low levels of chromium(V), but significant levels of chromium(III). Since the highest DNA binding was seen with dithiothreitol and ß-mercaptoethanol, this is further evidence implicating chromium(V) as the DNA-damaging agent, not chromium(III). Stable complexes of chromium(III) with glutathione and cysteine which possess tridentate ligation to nitrogen, oxygen, and sulfur have been characterized (56, 61). Glutathione and cysteine are expected to compete with DNA for reactive chromium species, and this competition may account for the lower Cr/DNA-P ratios observed with these thiols than with dithiothreitol and ß-mercaptoethanol, which are poorer ligands to chromium. A bis-cysteinate chromium(III) complex is formed quickly in the reaction of cysteine with chromium(VI), yet very low DNA-binding is effected by the cysteine reaction, indicating that chromium(III) is not the DNA damaging agent.
In summary, activation of chromium(VI) by thiols led to chromium binding to DNA (63), and the extent of chromium-DNA adduct formation depended on the nature of the thiol reductant used. Similar reactions in the absence of DNA clearly showed the presence of transient chromium(V) species, the level and kinetics of which depend on the thiol used.
Figure 3-2. EPR spectra of chromium(V) complexes formed upon reaction of potassium dichromate (0.48 mM chromium(VI)) with
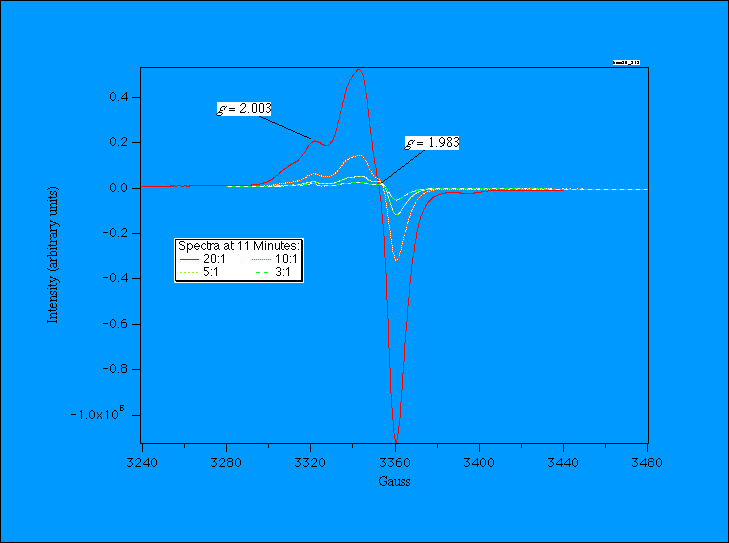
Figure 3-3. Time courses for chromium(V) formation during the reaction of potassium dichromate (0.48 mM chromium(VI)) and
b-mercaptoethanol (1.44 - 9.6 mM) in 0.050 M Tris-HCl, pH 7.0 at 37 °C. Reactions were initiated by addition of thiol, and aliquots (350 µL) of the reactions were taken at various times in quartz EPR tubes and quenched by immersion in liquid nitrogen. Chromium(V) concentration was determined by EPR spectroscopy at 77 K as described in the Methods. Values represent the mean ± S.D. of two determinations.placeholder for figure 3-3 bme_time
Figure 3-4. EPR spectra of chromium(III) complexes formed upon reaction of either chromium(III) or chromium(VI) with
b-mercaptoethanol. Spectra were obtained upon reaction of chromium(III) nitrate (0.48 mM chromium(III)) with b-mercaptoethanol (9.6 mM; 20:1 thiol:Cr ratio) after 24 hours at 25 °C or the reaction of potassium dichromate (0.48 mM chromium(VI)) and b-mercaptoethanol (9.6 mM) after 30 minutes at 37 °C or 24 hours at 25 °C . Reactions were performed in 0.050 M Tris-HCl, pH 7.0. Reactions were initiated by addition of thiol, and aliquots (350 µL) of the reactions were taken in quartz EPR tubes and quenched by immersion in liquid nitrogen. EPR spectra were obtained as described in Figure 3-2.placeholder for figure 3-4 bme20_268
Figure 3-5. Comparison of the EPR spectra of chromium(V) complexes formed upon reaction of potassium dichromate (0.48 mM chromium(VI)) with
b-mercaptoethanol (1.44-9.6 mM; 3-20:1 thiol:Cr ratio) in the presence of double-stranded calf thymus DNA (0.048 mM DNA-P; 10:1 Cr:DNA-P ratio). All reactions were performed at 37 °C in 0.050 M Tris-HCl, pH 7.0. Reactions were initiated by addition of thiol, and aliquots (350 µL) of the reactions were taken in quartz EPR tubes and quenched by immersion in liquid nitrogen. The spectra shown are for the 20 minute time points. EPR spectra were obtained as described in Figure 3-2.placeholder for Figure 3-5. bmeDNA_compare
Figure 3-6. Time courses for chromium(V) formation during the reaction of potassium dichromate (0.48 mM chromium(VI)) and
b-mercaptoethanol (1.44 - 9.6 mM) in the presence (solid markers) or absence (open markers) of double-stranded CT DNA. All reactions were performed at 37 °C for 30 min in 0.05 M Tris-HCl, pH 7.0. Reactions were initiated by addition of thiol, and aliquots (350 µL) of the reactions were taken at various times in quartz EPR tubes and quenched by immersion in liquid nitrogen. Chromium(V) concentration was determined by EPR spectroscopy at 77 K as described in the Methods. Values represent the mean ± S.D. of two determinations.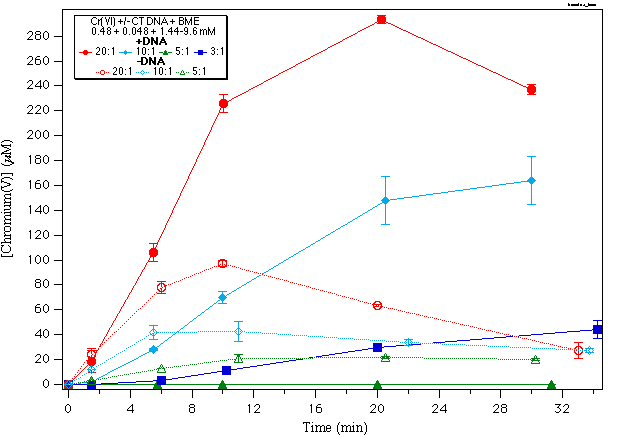
Figure 3-7. EPR spectra of chromium(V) complexes formed upon reaction of potassium dichromate (0.48 mM chromium(VI)) with
b-mercaptoethanol (9.6 mM; 20:1 thiol:Cr ratio) in the presence or absence of double-stranded CT DNA (0.048 mM DNA-P; 10:1 Cr:DNA-P ratio). All reactions were performed at 37 °C in 0.05 M Tris-HCl, pH 7.0. Reactions were initiated by addition of thiol, and aliquots (50 µL) of the reactions were taken at 30 minutes in Pyrex capillary tubes and EPR spectra were obtained at 297 K. The spectrometer settings were: 2 mW microwave power at a frequency of 9.773 GHz, 100 kHz field modulation, 1.0 Gauss modulation amplitude, 1.0 x 10⁵ receiver gain, 5.12 ms time constant, and a sweep time of 5 Gauss/sec; typically 3 scans were done at a 100 Gauss sweep width (~60 seconds total per spectrum).
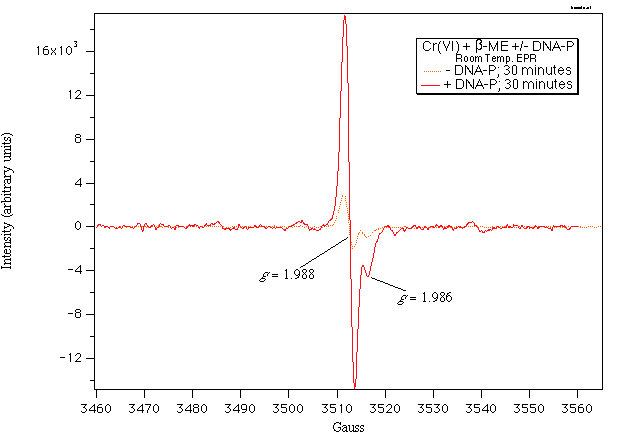
Figure 3-8. Time courses for formation of two separate chromium(V) species during the reaction of potassium dichromate (0.48 mM chromium(VI)) and
b-mercaptoethanol (9.6 mM) in the presence of double-stranded CT DNA. All reactions were performed at 37 °C in 0.05 M Tris-HCl, pH 7.0. Reactions were initiated by addition of thiol, and aliquots (50 µL) of the reactions were taken at various times in Pyrex capillary tubes and EPR spectra were obtained as described in Figure 3-7. Values represent the mean ± S.D. of two determinations. Note that these signals are not completely resolved, and the "intensity" value for the minor (g = 1.986) was approximated by It, while the major signal (g = 1.988) intensity was determined by DHpt2*Ipt, where It = zero-trough intensity (arbitrary units), Ipt = peak-trough intensity (arbitrary units), and DHpt is the linewidth (Gauss).placeholder for Figure 3-8 bmeDNART_time
Figure 3-9. EPR spectra of chromium(V) complexes formed upon reaction of potassium dichromate (0.48 mM chromium(VI)) with
b-mercaptoethanol (9.6 mM; 20:1 thiol:Cr ratio) in the presence of single-stranded calf thymus DNA (0.048 mM DNA-P; 10:1 Cr:DNA-P ratio), double-stranded calf thymus DNA (0.48 mM DNA-P; 1:1 Cr:DNA-P ratio), or double-stranded calf thymus DNA (0.0012 mM; 400:1 Cr:DNA ratio). All reactions were performed at 37 °C in 0.050 M Tris-HCl, pH 7.0. Reactions were initiated by addition of thiol, and aliquots (350 µL) of the reactions were taken at 10 minutes in quartz EPR tubes and quenched by immersion in liquid nitrogen. EPR spectra were obtained as described in Figure 3-2.
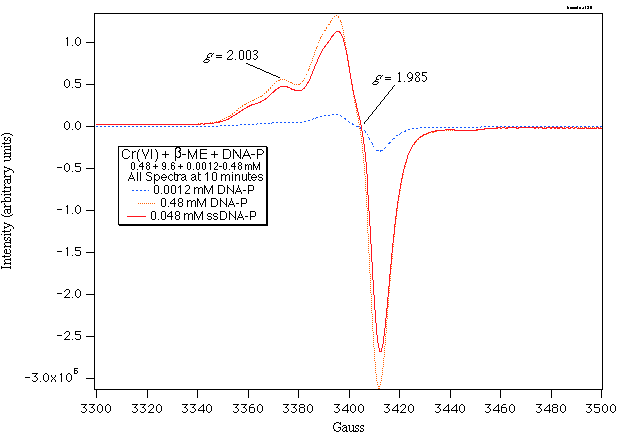
Figure 3-10. Time courses for chromium(V) formation during the reaction of potassium dichromate (0.48 mM chromium(VI)) and
b-mercaptoethanol (9.6 mM) in the presence of CT DNA (0.003-0.048 mM), poly(dG) (0.048 mM), 5'dGMP (0.048 mM) (solid markers), or absence of DNA (open markers). All reactions were performed at 37 °C in 0.050 M Tris-HCl, pH 7.0. Reactions were initiated by addition of thiol, and aliquots (350 µL) of the reactions were taken at various times in quartz EPR tubes and quenched by immersion in liquid nitrogen. Chromium(V) concentration was determined by EPR spectroscopy at 77 K as described in the Methods. Values represent the mean ± S.D. of two determinations.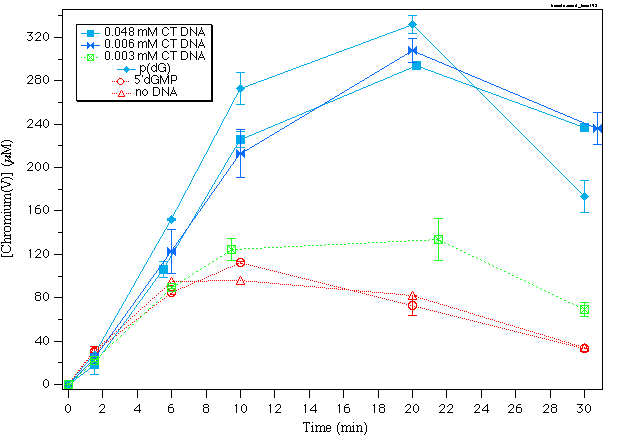
Figure 3-11. Time courses for chromium(V) formation during the reaction of potassium dichromate (0.48 mM chromium(VI)) and
b-mercaptoethanol (9.6 mM) in the presence (solid markers) or absence (open markers) of double-stranded CT DNA or DETAPAC. All reactions were performed at 37 °C for 30 min in 0.05 M Tris-HCl, pH 7.0. Reactions were initiated by addition of thiol, and aliquots (350 µL) of the reactions were taken at various times in quartz EPR tubes and quenched by immersion in liquid nitrogen. Chromium(V) concentration was determined by EPR spectroscopy at 77 K as described in the Methods. Values represent the mean ± S.D. of two determinations.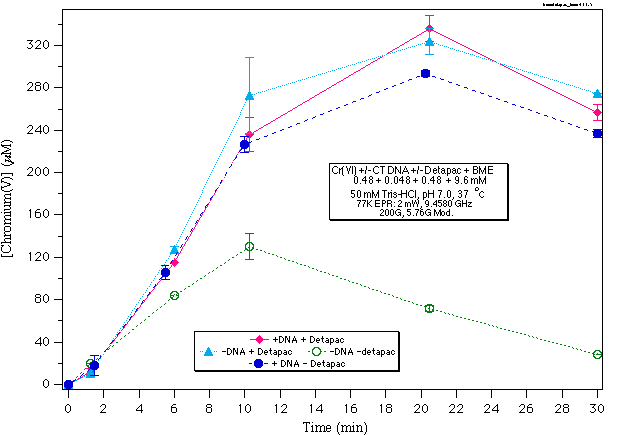
Figure 3-12. EPR spectra of chromium(V) complexes formed upon reaction of potassium dichromate (0.48 mM chromium(VI)) with
b-mercaptoethanol (9.6 mM; 20:1 thiol:Cr ratio) in the presence of DETAPAC (0.48 mM) and DMPO (100 mM). All reactions were performed at 37 °C in 0.05 M Tris-HCl, pH 7.0. Reactions were initiated by addition of thiol, and aliquots (50 µL) of the reactions were taken at 20 minutes in capillary tubes and EPR spectra were obtained as described in Figure 3-7.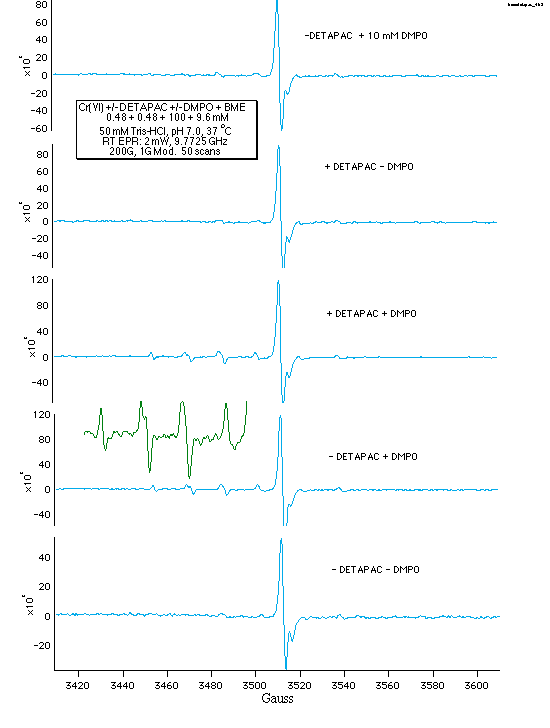
Figure 3-13. EPR spectra of chromium(V) (A) or DMPO-radical adduct (B) complexes formed upon reaction of potassium dichromate (0.48 mM chromium(VI)) with
b-mercaptoethanol (9.6 mM; 20:1 thiol:Cr ratio) in the presence of DES or DETAPAC (0.48 mM) and DMPO (100 mM). All reactions were performed at 37 °C in 0.05 M Tris-HCl, pH 7.0. Reactions were initiated by addition of thiol, and aliquots (50 µL) of the reactions were taken at 20 minutes in Pyrex capillary tubes and EPR spectra were obtained as described in Figure 3-7.placeholder for Figure 3-13
CrVdetapac463
.Figure 3-14. EPR spectra of chromium(V) (A) or DMPO-radical adduct (B) complexes formed upon reaction of potassium dichromate (0.48 mM chromium(VI)) with
b-mercaptoethanol (9.6 mM; 20:1 thiol:Cr ratio) in the presence of DETAPAC (0.48 mM) and DMPO (100 mM) under anaerobic conditions. All reactions were performed at 37 °C in 0.05 M Tris-HCl, pH 7.0. Reaction solutions were deoxygenated via repeated treatment with applied vacuum and subsequent nitrogen purge. Reactions were initiated by addition of thiol, and aliquots (50 µL) of the reactions were taken at 20 minutes in Pyrex capillary tubes and EPR spectra were obtained as described in Figure 3-7.A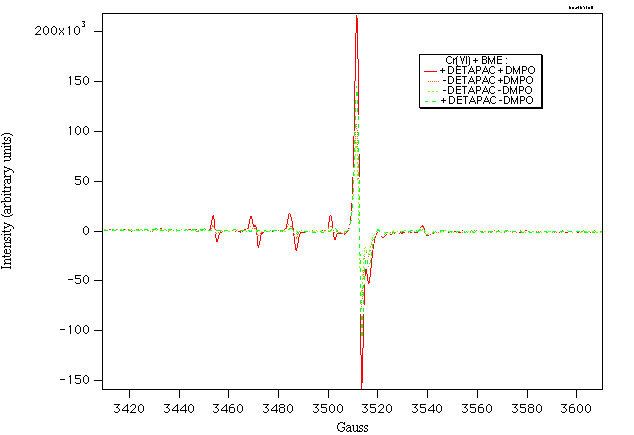
B
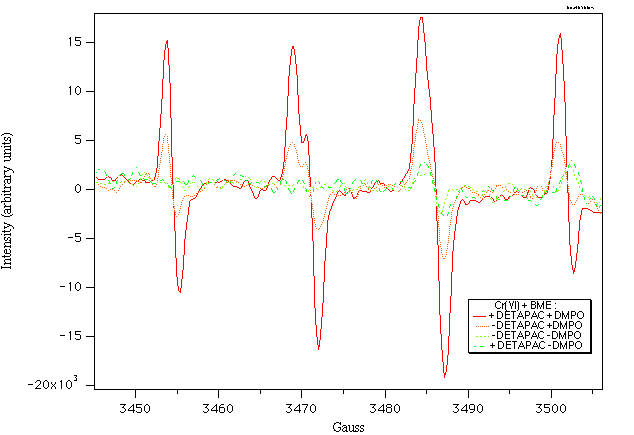
Figure 3-15. Computer simulation study of the EPR spectra of DMPO-radical adduct complexes formed upon reaction of potassium dichromate (0.48 mM chromium(VI)) with
b-mercaptoethanol (9.6 mM; 20:1 thiol:Cr ratio) in the presence of DETAPAC (0.48 mM) and DMPO (100 mM). All reactions were performed at 37 °C in 0.05 M Tris-HCl, pH 7.0. For the anaerobic reactions, solutions were deoxygenated as necessary via repeated treatment with applied vacuum and subsequent nitrogen purge. Reactions were initiated by addition of thiol, and aliquots (50 µL) of the reactions were taken at 20 minutes in Pyrex capillary tubes and the experimental EPR spectrum (solid trace) was obtained as described in Figure 3-7. Simulated spectra were obtained using the computer program SpinSim (see appendix), and composite simulated spectra were obtained by mixing the individual spectra in the relative amounts indicated.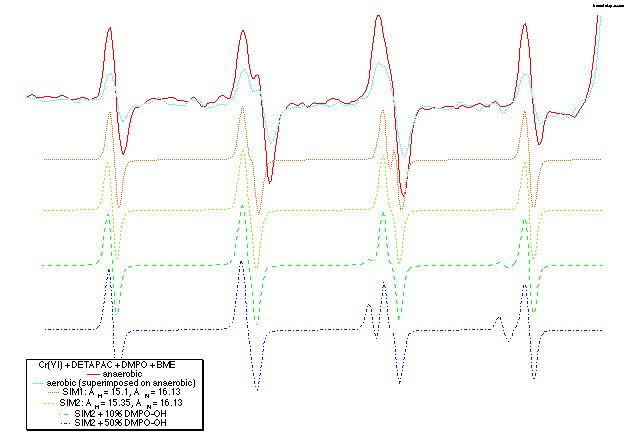
Figure 3-16. Comparison of the RT EPR spectra of chromium(V) complexes formed upon reaction of potassium dichromate (0.48 mM chromium(VI)) with
b-mercaptoethanol (9.6 mM; 20:1 thiol:Cr ratio) in the presence of DETAPAC (0.48 mM) and DMPO (100 mM) under anaerobic and aerobic conditions. All reactions were performed at 37 °C in 0.05 M Tris-HCl, pH 7.0. Reaction solutions were deoxygenated as necessary via repeated treatment with applied vacuum and subsequent nitrogen purge. Reactions were initiated by addition of thiol, and aliquots (50 µL) of the reactions were taken at 11 minutes in Pyrex capillary tubes and EPR spectra were obtained as described in Figure 3-7.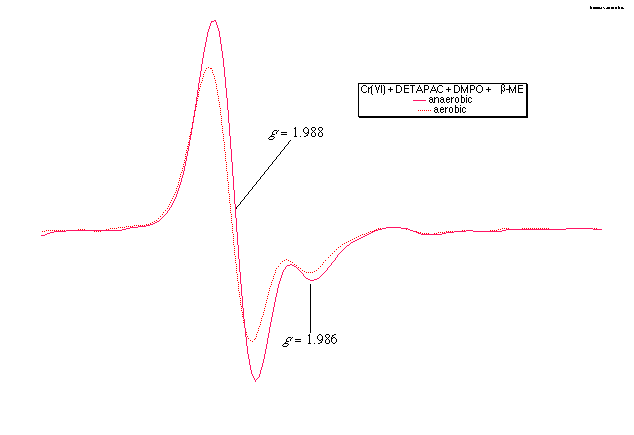
Figure 3-17. EPR spectra of chromium(V) (A) or DMPO-radical adduct (B) complexes formed upon reaction of potassium dichromate (0.48 mM chromium(VI)) with
b-mercaptoethanol (9.6 mM; 20:1 thiol:Cr ratio) in the presence of DETAPAC (0.48 mM), DMPO (100 mM) and ferrous ammonium sulfate (0-0.48 mM iron(II)). All reactions were performed at 37 °C in 0.05 M Tris-HCl, pH 7.0. Reactions were initiated by addition of thiol, and aliquots (50 µL) of the reactions were taken at 20 minutes in Pyrex capillary tubes and EPR spectra were obtained as described in Figure 3-7.A
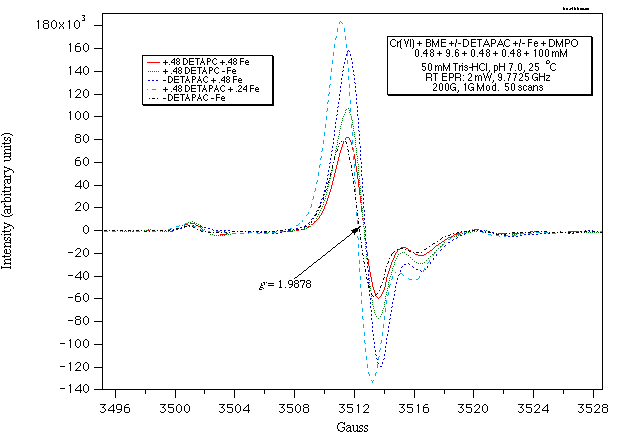
B
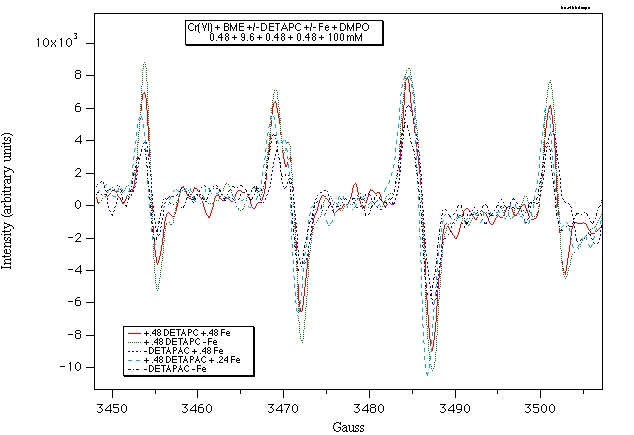
Figure 3-18. Comparison of the EPR signal intensities of (A) chromium(V) and (B) DMPO-radical adduct complexes formed upon reaction of potassium dichromate (0.48 mM chromium(VI)) with
b-mercaptoethanol (9.6 mM; 20:1 thiol:Cr ratio) in the presence or absence of DETAPAC (0.48 mM), DMPO (100 mM) and ferrous ammonium sulfate (0-0.48 mM iron(II)). All reactions were performed at 37 °C in 0.05 M Tris-HCl, pH 7.0. Reactions were initiated by addition of thiol, and aliquots (50 µL) of the reactions were taken at 20 minutes in Pyrex capillary tubes and EPR spectra were obtained as described in Figure 3-7.placeholder for Figure 3-18
bmeDETAPACFePlot 466
Figure 3-19. EPR spectra of chromium(V) complexes formed upon reaction of potassium dichromate (0.48 mM chromium(VI)) with dithiothreitol (1.44, 2.4, 4.8, or 9.6 mM; 3,5,10, or 20:1 thiol:Cr ratios). All reactions were performed at 37 °C in 0.05 M Tris-HCl, pH 7.0. Reactions were initiated by addition of thiol, and aliquots (350 µL) of the reactions were taken at various times in quartz EPR tubes and quenched by immersion in liquid nitrogen. The representative spectra shown were obtained at 3.5-6 minutes after the start of the reactions. EPR spectra were obtained as described in Figure 3-2.
placeholder for figure 3-19 dtt20_245
Figure 3-20. Time courses for chromium(V) formation during the reaction of potassium dichromate (0.48 mM chromium(VI)) and dithiothreitol (1.44 - 9.6 mM) in 0.05 M Tris-HCl, pH 7.0 at 37 °C. Reactions were initiated by addition of thiol, and aliquots (350 µL) of the reactions were taken at various times in quartz EPR tubes and quenched by immersion in liquid nitrogen. Chromium(V) concentration was determined by EPR spectroscopy at 77 K as described in the Methods. Values represent the mean ± S.D. of two determinations.
placeholder for figure 3-20 dtt_time
Figure 3-21. EPR spectra of chromium(III) complexes formed upon reaction of either chromium(III) or chromium(VI) with dithiothreitol. Spectra shown are formed upon reaction of chromium(III) nitrate (0.48 mM chromium(III)) with dithiothreitol (9.6 mM; 20:1 thiol:Cr ratio) for 5 minutes and 24 hours at 25 °C or the reaction of potassium dichromate (0.48 mM chromium(VI)) and dithiothreitol (9.6 mM) for 24 hours at 37 °C. Reactions were performed in 0.05 M Tris-HCl, pH 7.0. Reactions were initiated by addition of thiol, and aliquots (350 µL) of the reactions were taken in quartz EPR tubes and quenched by immersion in liquid nitrogen. EPR spectra were obtained as described in Figure 3-2.
placeholder for figure 3-21 dtt20_268
Figure 3-22. EPR spectra of chromium(V) complexes formed upon reaction of potassium dichromate (0.48 mM chromium(VI)) with dithiothreitol (1,44, 2.4, 4.8, or 9.6 mM; 3,5,10 or 20:1 thiol:Cr ratio) in the presence of double-stranded calf thymus DNA (0.048 mM; 10:1 Cr:DNA ratio). All reactions were performed at 37 °C for 30 min in 0.05 M Tris-HCl, pH 7.0. Reactions were initiated by addition of thiol, and aliquots (350 µL) of the reactions were taken at 5.5 minutes in quartz EPR tubes and quenched by immersion in liquid nitrogen. EPR spectra were obtained as described in Figure 3-2.
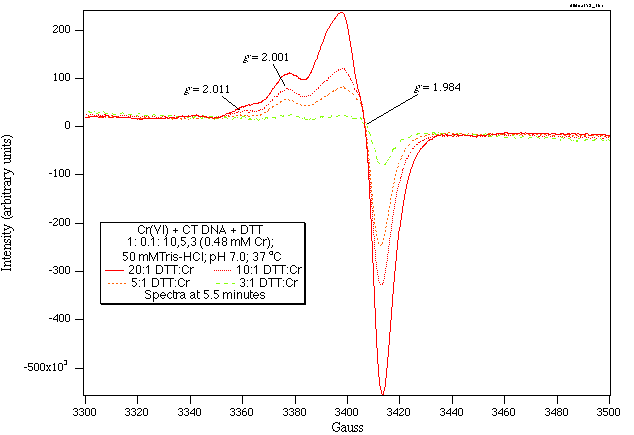
Figure 3-23. Time courses for chromium(V) formation during the reaction of potassium dichromate (0.48 mM chromium(VI)) and dithiothreitol ((A) 4.8, 9.6 mM; (B) 1.44, 2.4 mM) in the presence or absence of double-stranded calf thymus DNA (0.048 mM; 10:1 Cr:DNA ratio) in 0.05 M Tris-HCl, pH 7.0 at 37 °C. Reactions were initiated by addition of thiol, and aliquots (350 µL) of the reactions were taken at various times in quartz EPR tubes and quenched by immersion in liquid nitrogen. Chromium(V) concentration was determined by EPR spectroscopy at 77 K as described in the Methods. Values represent the mean ± S.D. of two determinations.
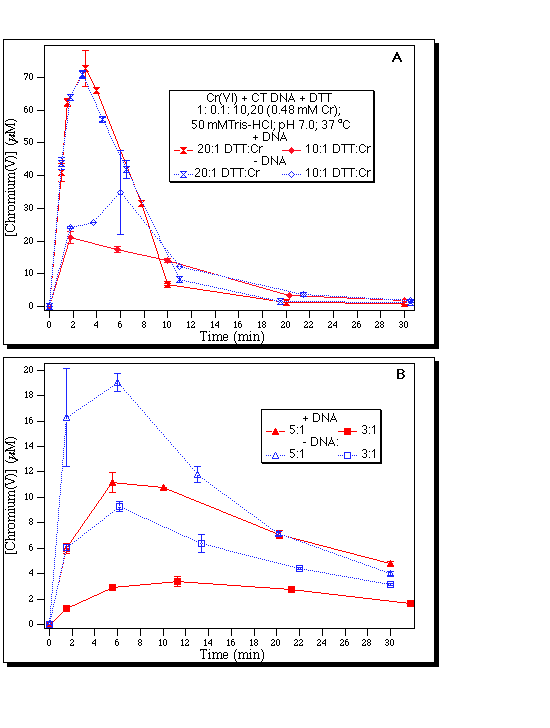
Figure 3-24. EPR spectra of chromium(V) complexes formed upon reaction of potassium dichromate (0.48 mM chromium(VI)) with dithiothreitol (9.6 mM; 20:1 thiol:Cr ratio) in the presence of poly(dG) (0.048 mM; 10:1 Cr:polynucleotide ratio). All reactions were performed at 37 °C in 0.05 M Tris-HCl, pH 7.0. Reactions were initiated by addition of thiol, and aliquots (350 µL) of the reactions were taken at 1.5-4.5 minutes in quartz EPR tubes and quenched by immersion in liquid nitrogen. EPR spectra were obtained as described in Figure 3-2.
placeholder for figure 3-24 dttDG399
Figure 3-25. Time courses for chromium(V) formation during the reaction of potassium dichromate (0.48 mM chromium(VI)) and dithiothreitol (9.6 mM) in the presence of poly(dG) (0.048 mM; 10:1 Cr:polynucleotide ratio) in 0.05 M Tris-HCl, pH 7.0 at 37 °C. Reactions were initiated by addition of thiol, and aliquots (350 µL) of the reactions were taken at various times in quartz EPR tubes and quenched by immersion in liquid nitrogen. Chromium(V) concentration was determined by EPR spectroscopy at 77 K as described in the Methods. Values represent the mean ± S.D. of two determinations.
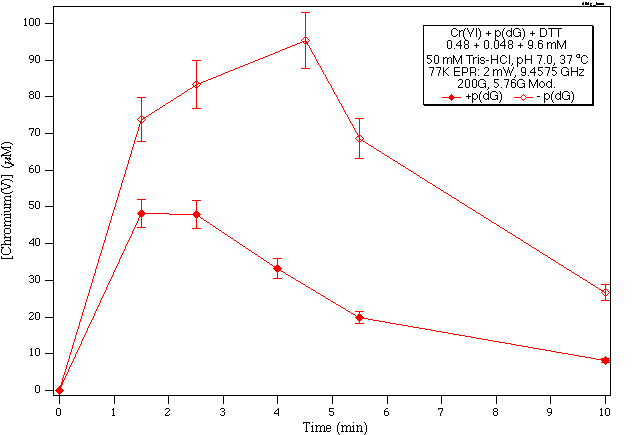
Figure 3-26. EPR spectra of chromium(V) complexes formed upon reaction of potassium dichromate (0.48 mM chromium(VI)) with glutathione (1.44-9.6 mM; 3, 5 ,10, or 20:1 thiol:Cr ratios). All reactions were performed at 37 °C in 0.05 M Tris-HCl, pH 7.0. Reactions were initiated by addition of thiol, and aliquots (350 µL) of the reactions were taken at various times in quartz EPR tubes and quenched by immersion in liquid nitrogen. The representative spectra shown were obtained at 5 minutes after the start of the reactions. EPR spectra were obtained as described in Figure 3-2.
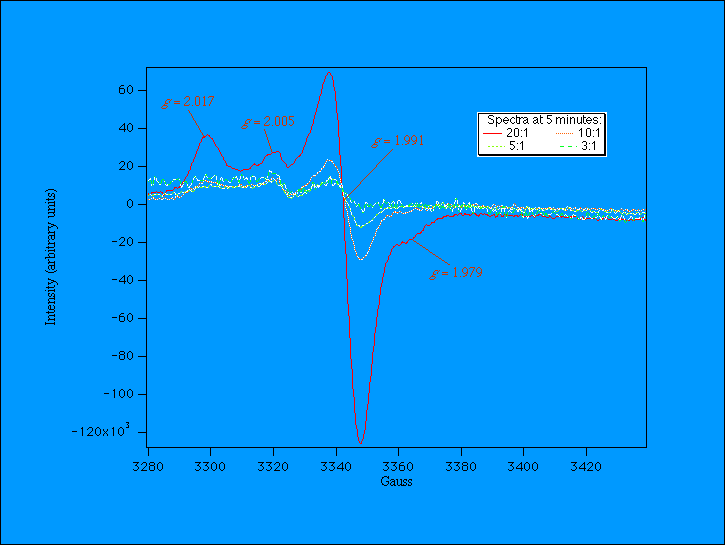
Figure 3-27. Time courses for chromium(V) formation during the reaction of potassium dichromate (0.48 mM chromium(VI)) and glutathione(1.44 - 9.6 mM) in 0.05 M Tris-HCl, pH 7.0 at 37 °C. Reactions were initiated by addition of thiol, and aliquots (350 µL) of the reactions were taken at various times in quartz EPR tubes and quenched by immersion in liquid nitrogen. Chromium(V) concentration was determined by EPR spectroscopy at 77 K as described in the Methods. Values represent the mean ± S.D. of two determinations.
placeholder for figure 3-27 gsh_time
Figure 3-28. EPR spectra of chromium(III) complexes formed upon reaction of either chromium(III) or chromium(VI) with glutathione. Spectra shown are formed upon reaction of chromium(III) nitrate (0.48 mM chromium(III)) with glutathione (9.6 mM; 20:1 thiol:Cr ratio) for 5 minutes and 24 hours at 25 °C or the reaction of potassium dichromate (0.48 mM chromium(VI)) and glutathione (9.6 mM)for 24 hours at 37 °C. Reactions were performed in 0.05 M Tris-HCl, pH 7.0. Reactions were initiated by addition of thiol, and aliquots (350 µL) of the reactions were taken at various times in quartz EPR tubes and quenched by immersion in liquid nitrogen. EPR spectra were obtained as described in Figure 3-2.
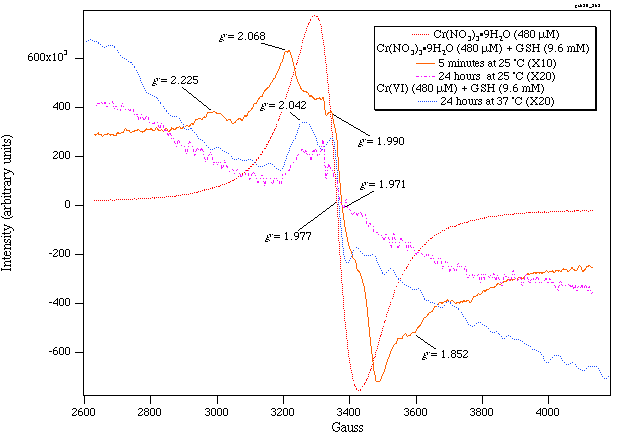
Figure 3-29. EPR spectra of chromium(V) complexes formed upon reaction of potassium dichromate (0.48 mM chromium(VI)) with glutathione (9.6 mM; 20:1 thiol:Cr ratio) in the presence of double-stranded calf thymus DNA (0.048 mM; 10:1 Cr:DNA ratio). The insert to the figure compares the spectra observed in the presence or absence of DNA at 5.5 minutes. All reactions were performed at 37 °C for 30 min in 0.05 M Tris-HCl, pH 7.0. Reactions were initiated by addition of thiol, and aliquots (350 µL) of the reactions were taken at various times in quartz EPR tubes and quenched by immersion in liquid nitrogen. EPR spectra were obtained as described in Figure 3-2.
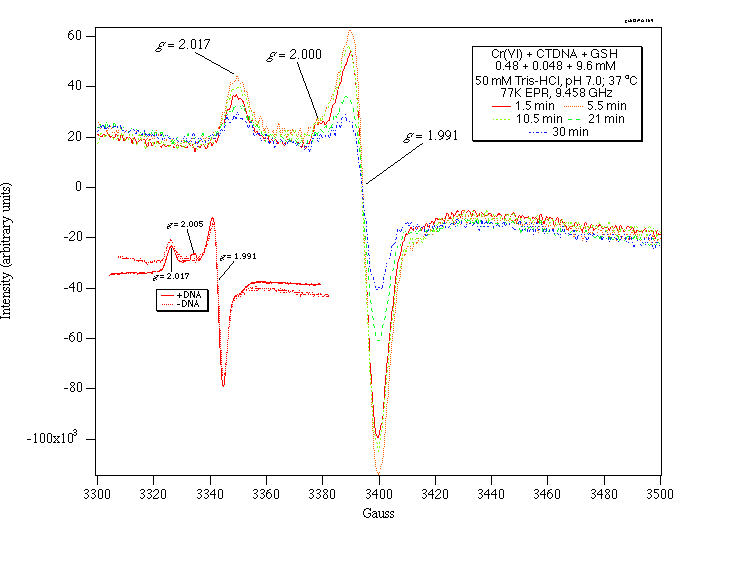
Figure 3-30. Time courses for chromium(V) formation during the reaction of potassium dichromate (0.48 mM chromium(VI)) and glutathione (9.6 mM) in the presence of double-stranded calf thymus DNA (0.048 mM; 10:1 Cr:DNA ratio) in 0.05 M Tris-HCl, pH 7.0 at 37 °C. Reactions were initiated by addition of thiol, and aliquots (350 µL) of the reactions were taken at various times in quartz EPR tubes and quenched by immersion in liquid nitrogen. Chromium(V) concentration was determined by EPR spectroscopy at 77 K as described in the Methods. Values represent the mean ± S.D. of two determinations.
placeholder for figure 3-30 gshDNA_time
c1.Figure 3-31. EPR spectra of chromium(V) complexes formed upon reaction of potassium dichromate (0.48 mM chromium(VI)) with cysteine (1.44-9.6 mM; 3, 5, 10, or 20:1 thiol:Cr ratios). All reactions were performed at 37 °C in 0.05 M Tris-HCl, pH 7.0. Reactions were initiated by addition of thiol, and aliquots (350 µL) of the reactions were taken at 1.5 minutes in quartz EPR tubes and quenched by immersion in liquid nitrogen. EPR spectra were obtained as described in Figure 3-2.
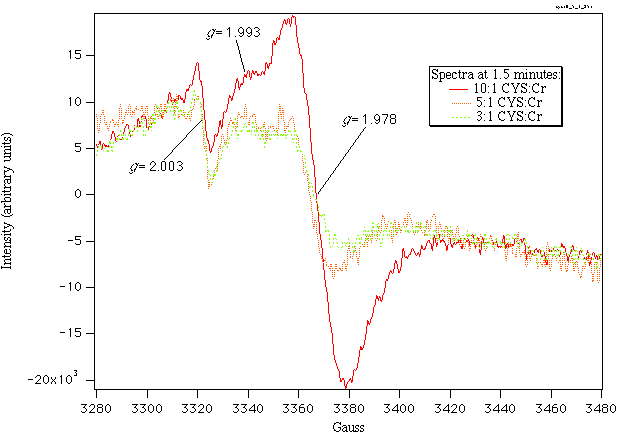
Figure 3-32. Time courses for chromium(V) formation during the reaction of potassium dichromate (0.48 mM chromium(VI)) and cysteine (1.44 - 9.6 mM) in 0.05 M Tris-HCl, pH 7.0 at 37 °C. Reactions were initiated by addition of thiol, and aliquots (350 µL) of the reactions were taken at various times in quartz EPR tubes and quenched by immersion in liquid nitrogen. Chromium(V) concentration was determined by EPR spectroscopy at 77 K as described in the Methods. Values represent the mean ± S.D. of two determinations.
placeholder for figure 3-32 cys_time
Figure 3-33. EPR spectra of chromium(III) complexes formed upon reaction of either chromium(III) or chromium(VI) with cysteine. Spectra shown are formed upon reaction of chromium(III) nitrate (0.48 mM chromium(III)) with cysteine (9.6 mM; 20:1 thiol:Cr ratio) for 5 minutes at 25 °C or the reaction of potassium dichromate (0.48 mM chromium(VI)) and cysteine (9.6 mM)for 24 hours at 37 °C. Reactions were performed in 0.05 M Tris-HCl, pH 7.0. Reactions were initiated by addition of thiol, and aliquots (350 µL) of the reactions were taken in quartz EPR tubes and quenched by immersion in liquid nitrogen. EPR spectra were obtained as described in Figure 3-2.
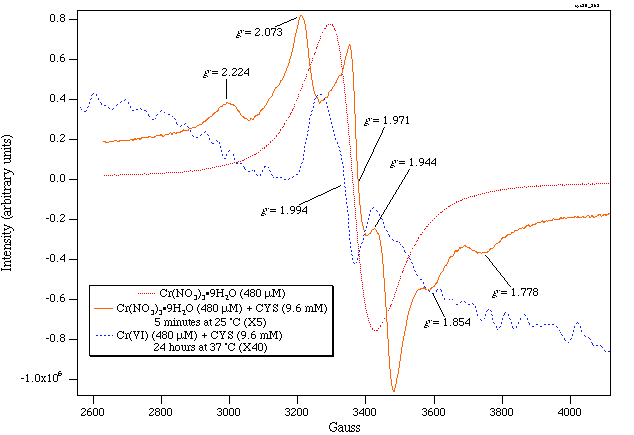
Figure 3-34. EPR spectra of potassium dichromate (0.48 mM chromium(VI)) incubated with cysteine (9.6 mM; 20:1 thiol:Cr ratio) at 37 °C for (
. . . . ) 10 min or (- - - ) 30 min in 0.05 M Tris-HCl, pH 7.0. Aliquots (350 µL) of the reaction were taken in a quartz EPR tubes and quenched by immersion in liquid nitrogen. EPR spectrum of (___) Cr(III)(L-cysteine)2 (0.79 mM) in H2O, pH 7. EPR spectra were obtained as described in Figure 3-2.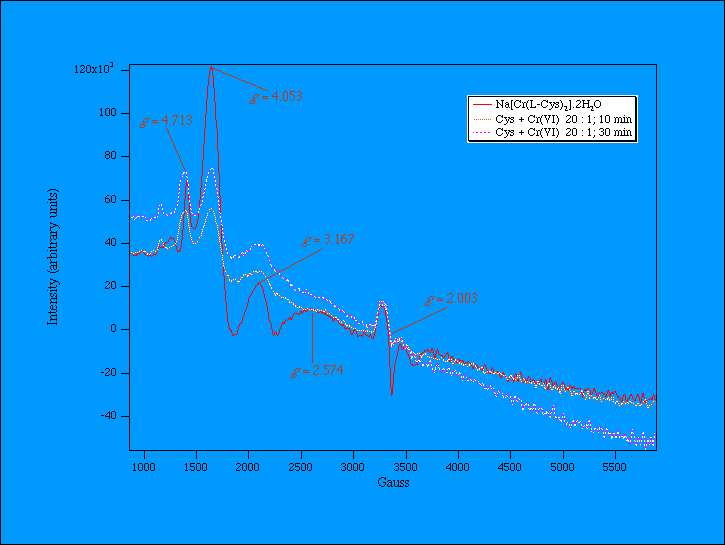
Figure 3-35. Electronic spectrum of potassium dichromate (0.48 mM chromium(VI)) incubated with cysteine (9.6 mM; 20:1 thiol:Cr ratio) at 37 °C for 30 min in 0.05 M Tris-HCl, pH 7.0, and electronic spectrum of Cr
III(L-cysteine)2 (0.79 mM) in 0.05 M Tris-HCl, pH 7.0. Electronic spectra were obtained on a Perkin-Elmer Lambda-9 Dual-Beam Spectrometer, using a 1 cm path length and a slit width of 2 nm. A jacketed cell holder attached to a Lauda water bath was used to maintain temperature. Spectra were fitted to a sum of Gaussian functions using Igor software by Wavemetrics, Inc. on an Apple Macintosh computer.Placeholder for Figure 3-35 biscysteinateuv
Figure 3-36. EPR spectra of chromium(V) complexes formed upon reaction of potassium dichromate (0.48 mM chromium(VI)) with cysteine (9.6 mM; 20:1 thiol:Cr ratio) in the presence of double-stranded calf thymus DNA (0.048 mM; 10:1 Cr:DNA ratio). All reactions were performed at 37 °C in 0.05 M Tris-HCl, pH 7.0. Reactions were initiated by addition of thiol, and aliquots (350 µL) of the reactions were taken at various times in quartz EPR tubes and quenched by immersion in liquid nitrogen. The inset to the figure is a comparison of the chromium(V) EPR spectra observed in the presence or absence of DNA under the same conditions at 1.75 minutes. EPR spectra were obtained as described in Figure 3-2.
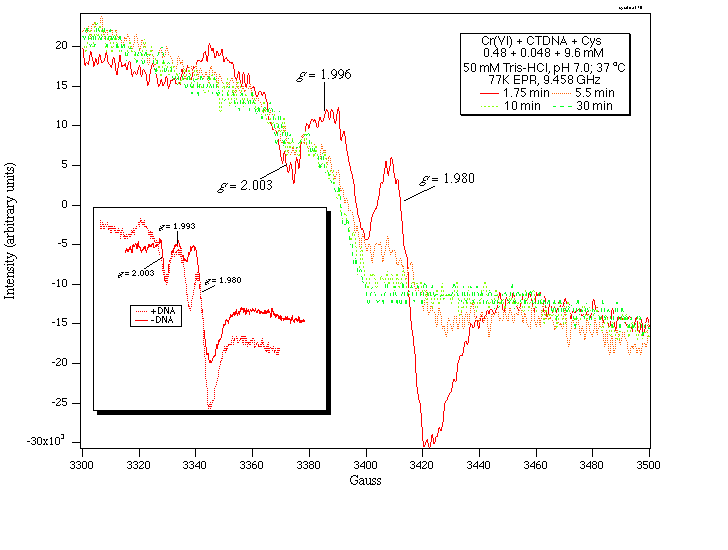
Figure 3-37. Time courses for chromium(V) formation during the reaction of potassium dichromate (0.48 mM chromium(VI)) and cysteine (9.6 mM) in the presence of double-stranded calf thymus DNA (0.048 mM; 10:1 Cr:DNA ratio) in 0.05 M Tris-HCl, pH 7.0 at 37 °C. Reactions were initiated by addition of thiol, and aliquots (350 µL) of the reactions were taken at various times in quartz EPR tubes and quenched by immersion in liquid nitrogen. Chromium(V) concentration was determined by EPR spectroscopy at 77 K as described in the Methods. Values represent the mean ± S.D. of two determinations.
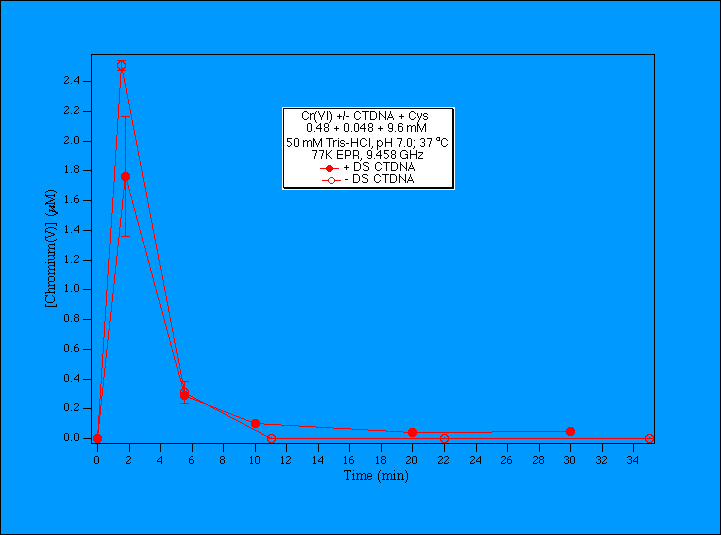
Figure 3-38. EPR spectra of chromium(III) complex formed upon reaction of potassium dichromate (0.48 mM chromium(VI)) with cysteine (9.6 mM; 20:1 thiol:Cr ratio) in the presence of double-stranded calf thymus DNA (0.048 mM; 10:1 Cr:DNA ratio). All reactions were performed at 37 °C for 30 min in 0.05 M Tris-HCl, pH 7.0. Reactions were initiated by addition of thiol, and aliquots (350 µL) of the reactions were taken at 30 minutes in quartz EPR tubes and quenched by immersion in liquid nitrogen. EPR spectra were obtained as described in Figure 3-2, with a sweep width of 5000 Gauss employed.
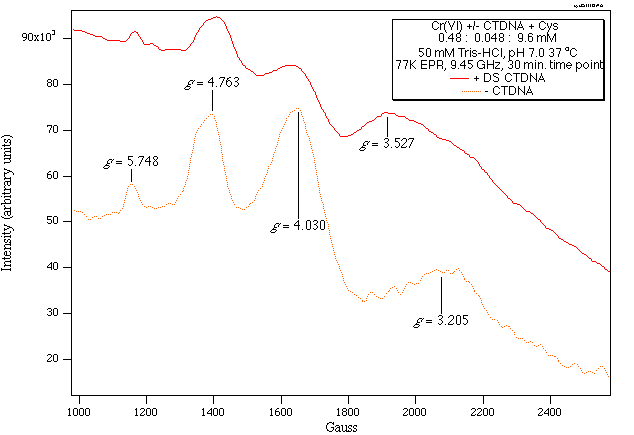
Figure 3-39. Energy level diagram showing the effect of zero field splittings on the fields at which the
DMs = 1 transitions occur in an S = 3/2 system (adapted from (60)).
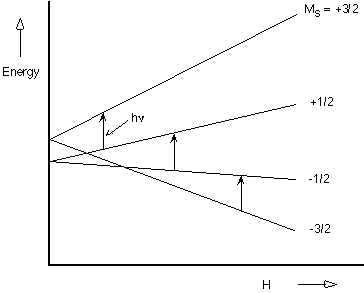
Figure 3-40. EPR spectra observed upon reaction of Cr(NO
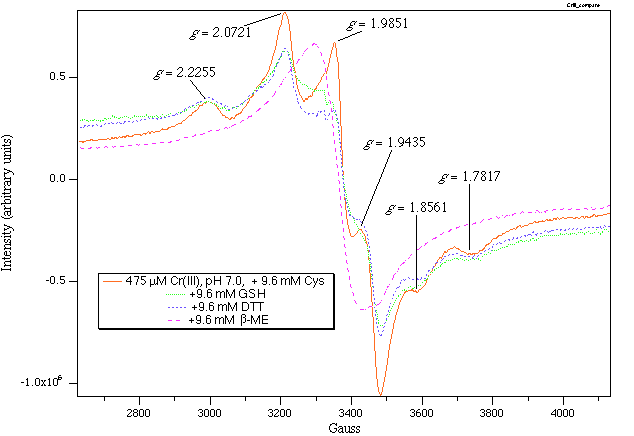
Figure 3-41. Proposed structures of the chromium(III)-thiol complexes formed upon incubation of hexaaquochromium(III) with (A) dithiothreitol, (B)
b-mercaptoethanol, and (C) glutathione.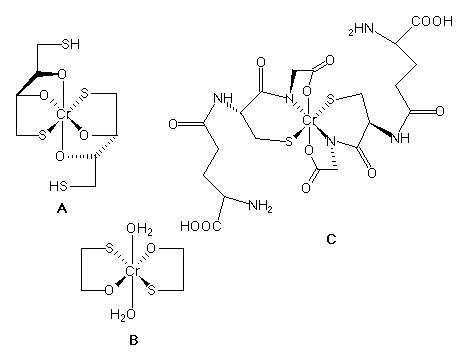
Figure 3-42. Crystal structure of the [Cr(L-cys)
2]- anion in Na[Cr(L-cys)2]•2H2O. From reference (56).